Ultimate eCommerce Content Analytics via Google Analytics & GTM
See how to build content analytics reports and dashboards that you never thought was possible via Google Analytics and GTM.

Brad Redding
Brad Redding is the Founder & CEO of Elevar. Specializing in analytics, tracking, GTM, and conversion optimization.
Content marketing costs 62% less than traditional marketing and generates about 3 times as many lead according to research from DemandMetric.
But – how does content marketing fit within eCommerce?
- Brand authority
- Improved customer connections
- Improved SEO
- Lower cost per acquisition

If you’re like me, there isn’t enough time in the day to do everything we want or think we can do. So understanding the type of content that performs best is paramount to maximizing your time invested when writing new content.
I need data to guide the type of content I should be writing for our clients or our own business.
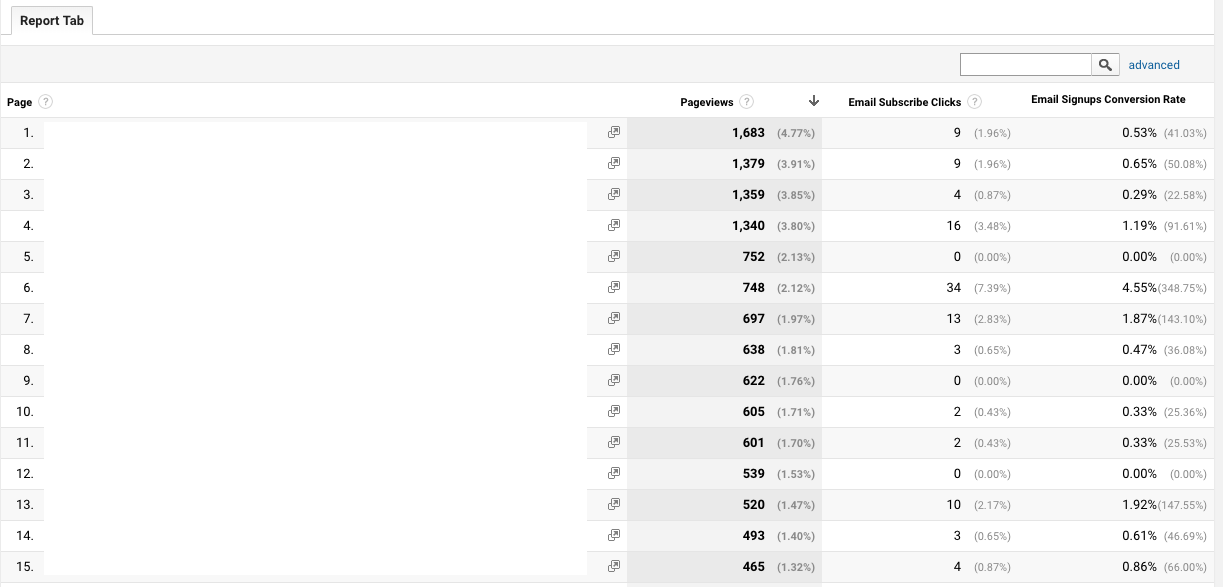
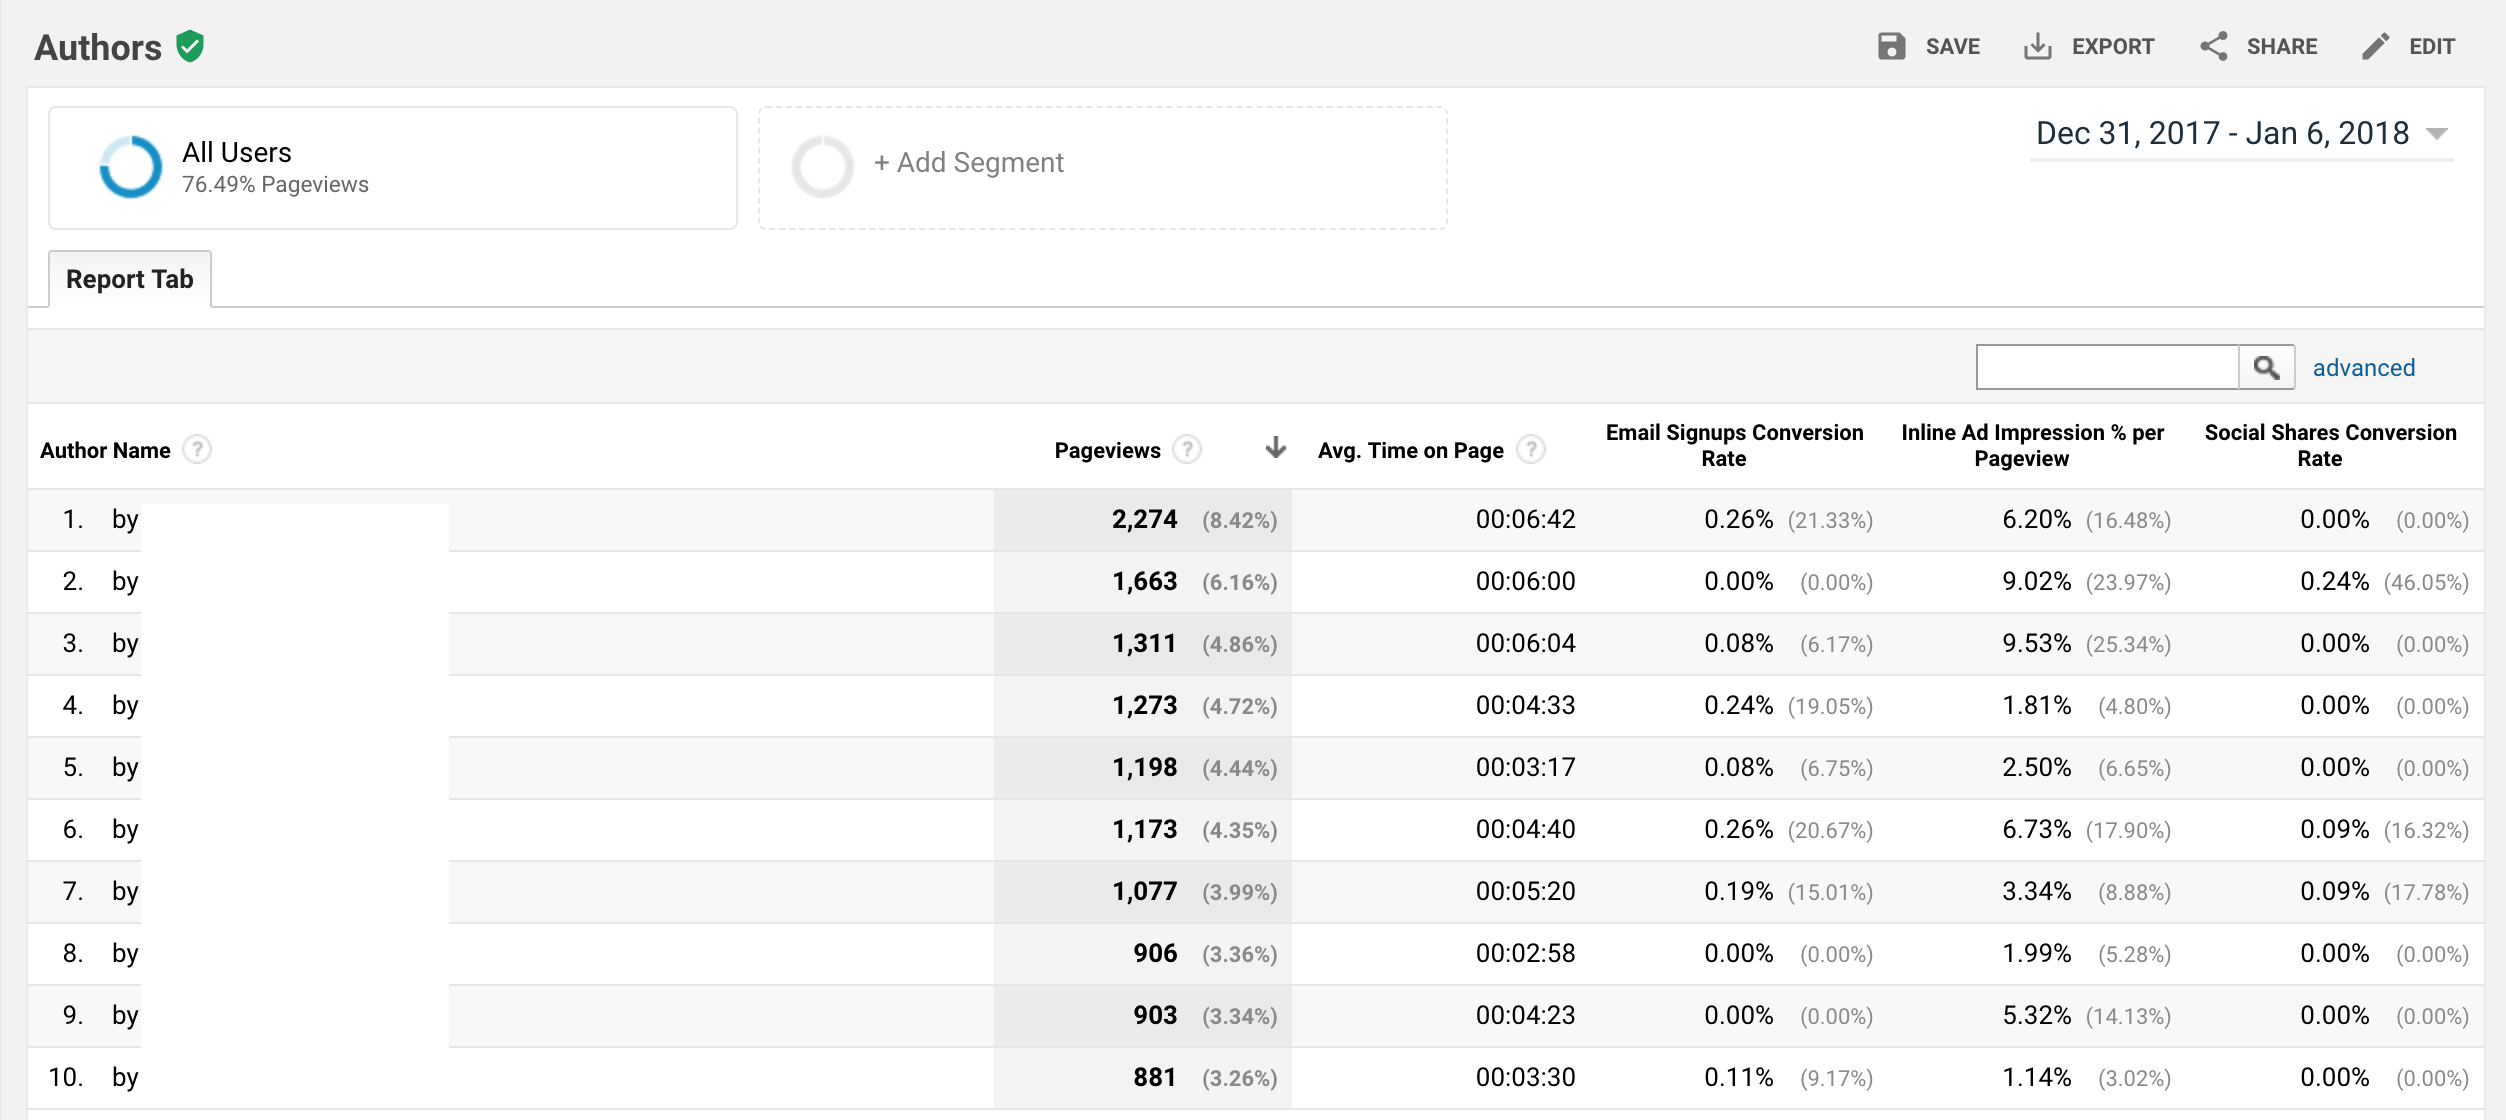
With reports like this that give me sortable key metrics on each page:
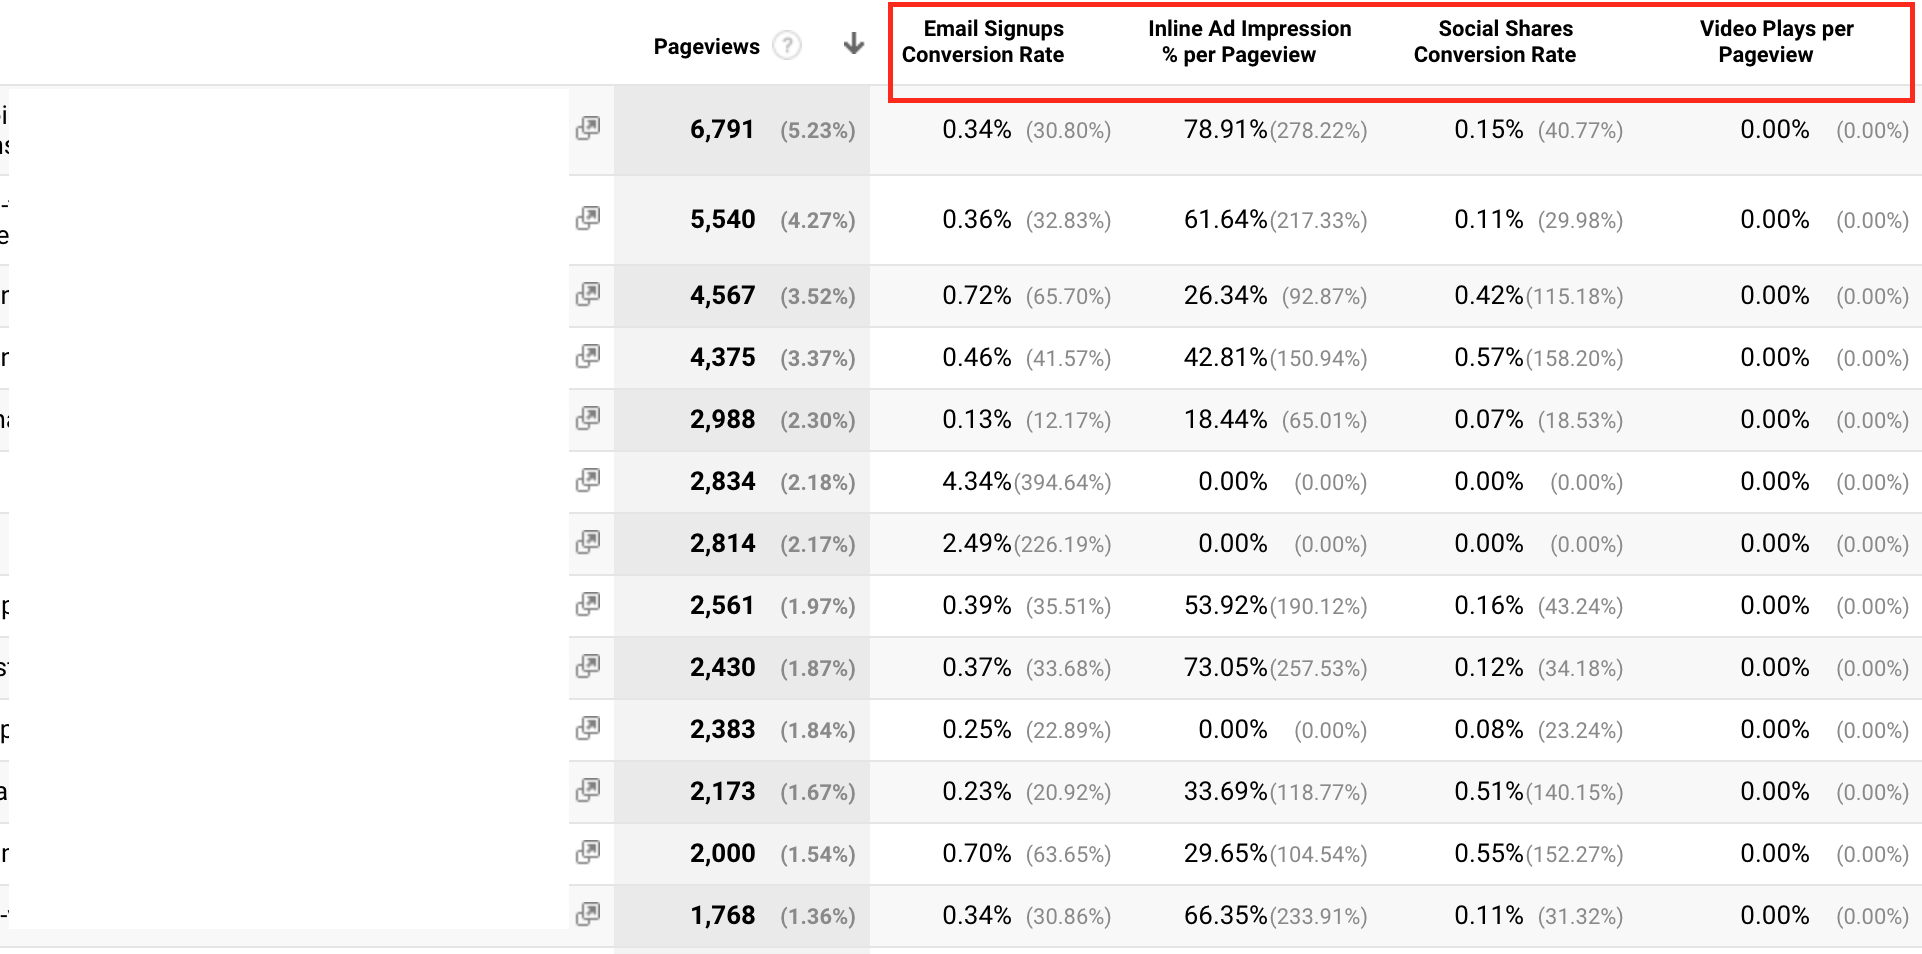
Notice how I’ve translated the # of email signups, shares, video plays etc per page into % of pageviews for more context.
A 2.5% vs 0.36% email signup per page means a lot more to me than 76 vs 24 signups. If you have value associated to email signup goals then you can start building a planned media spend ROI with a bit more accuracy:
([Estimated traffic/clicks] x [email conversion rate] x [email value] – [campaign cost] = Estimated Net Return
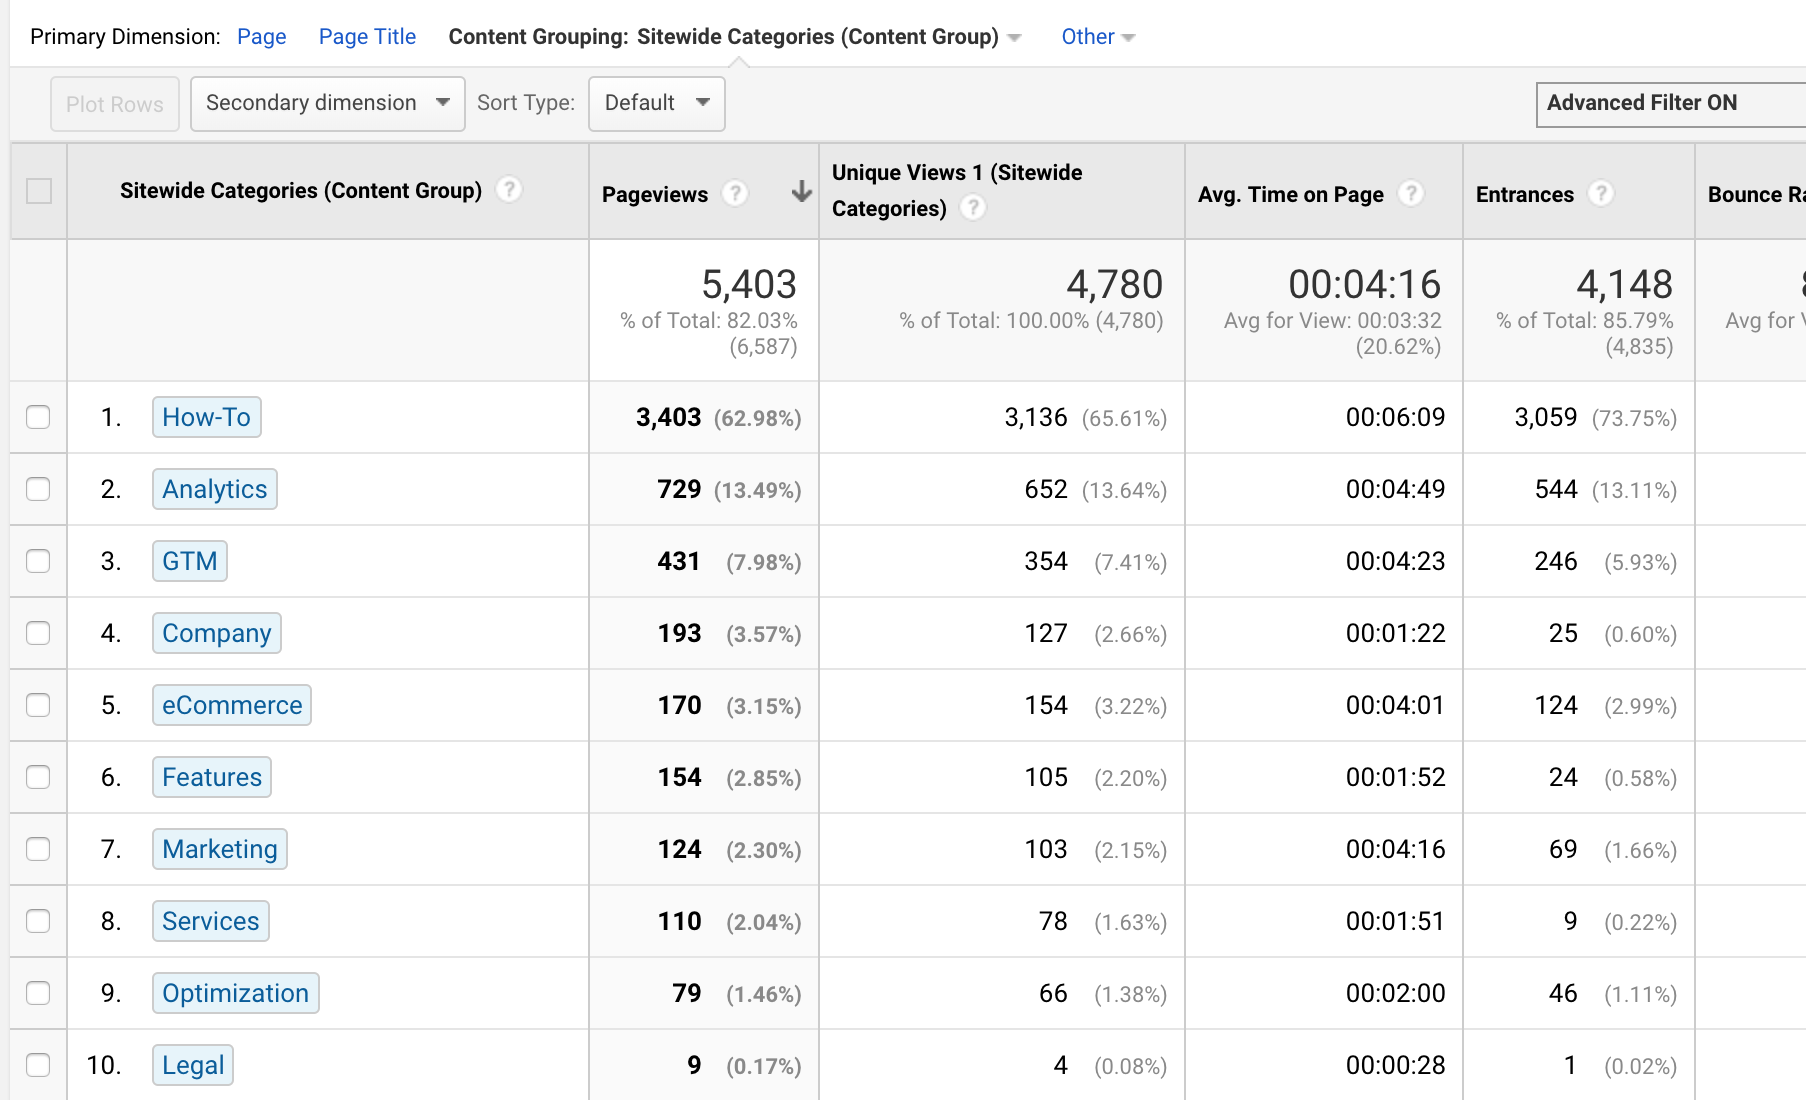
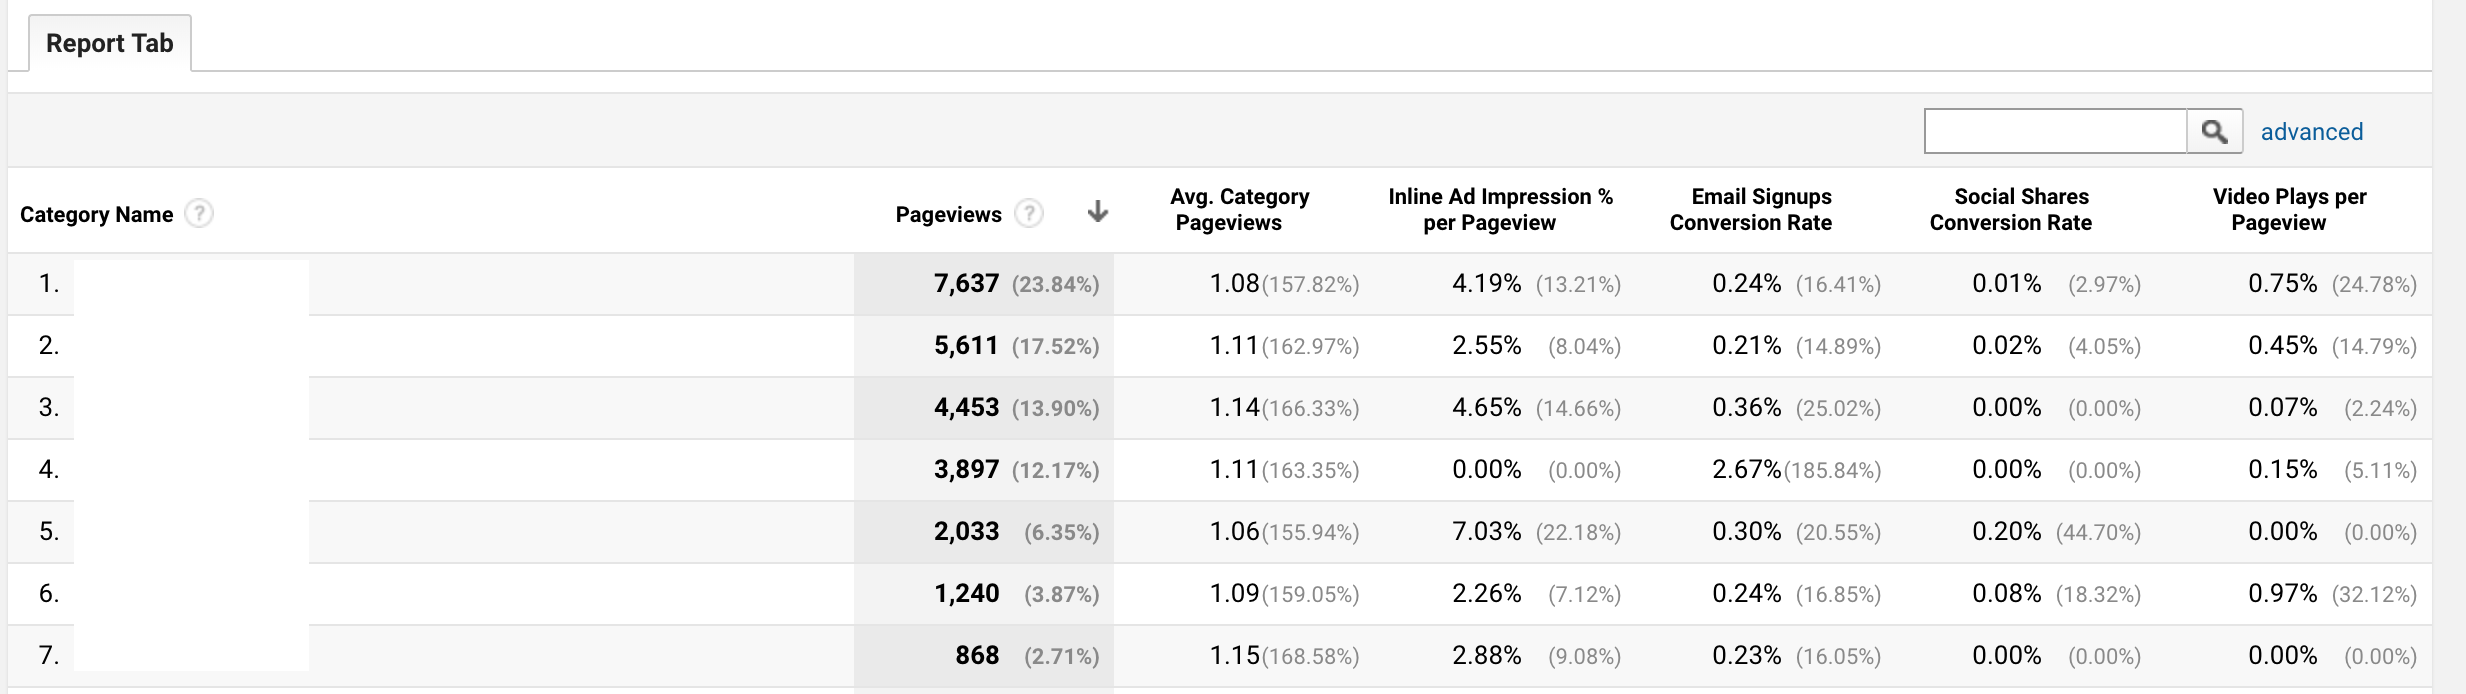
Or how about this report thats allows me to understand my best performing categories:
This guide will show you how to create your own advanced content analytics dashboard using a combination of Google Analytics and Google Tag Manager features.
You’ll learn how to create and report on the following metric and dimension combinations:
- Social shares
- Video plays
- Email sign ups
- Scroll depth
- Promotional block impressions
- Custom Dimensions
- Content Grouping
- Traffic Sources
- Loyalty (new vs returning users)
- Device Traffic
I’m using a heavy dose of Google Tag Manager, so I recommend refreshing on my other how-to articles:
- How to quickly find click classes for GTM tags
- How to create video play triggers for GTM
- How to use the element visibility trigger for GTM
- How to implement native scroll depth tracking in GTM
And a note on constraints within standard Google Analytics vs 360 (paid version):
- 20 custom metrics available in standard GA, 200 in 360
- 20 custom dimensions available in standard GA, 200 in 360
- 5 calculated metrics available in standard GA, 50 in 360
Now show me the data!
Social Share Analytics
I’ll be setting this up with:
- Google Analytics custom metric
- Google Analytics calculated metric
- GTM custom triggers
- GTM custom event tag
- Google Analytics events
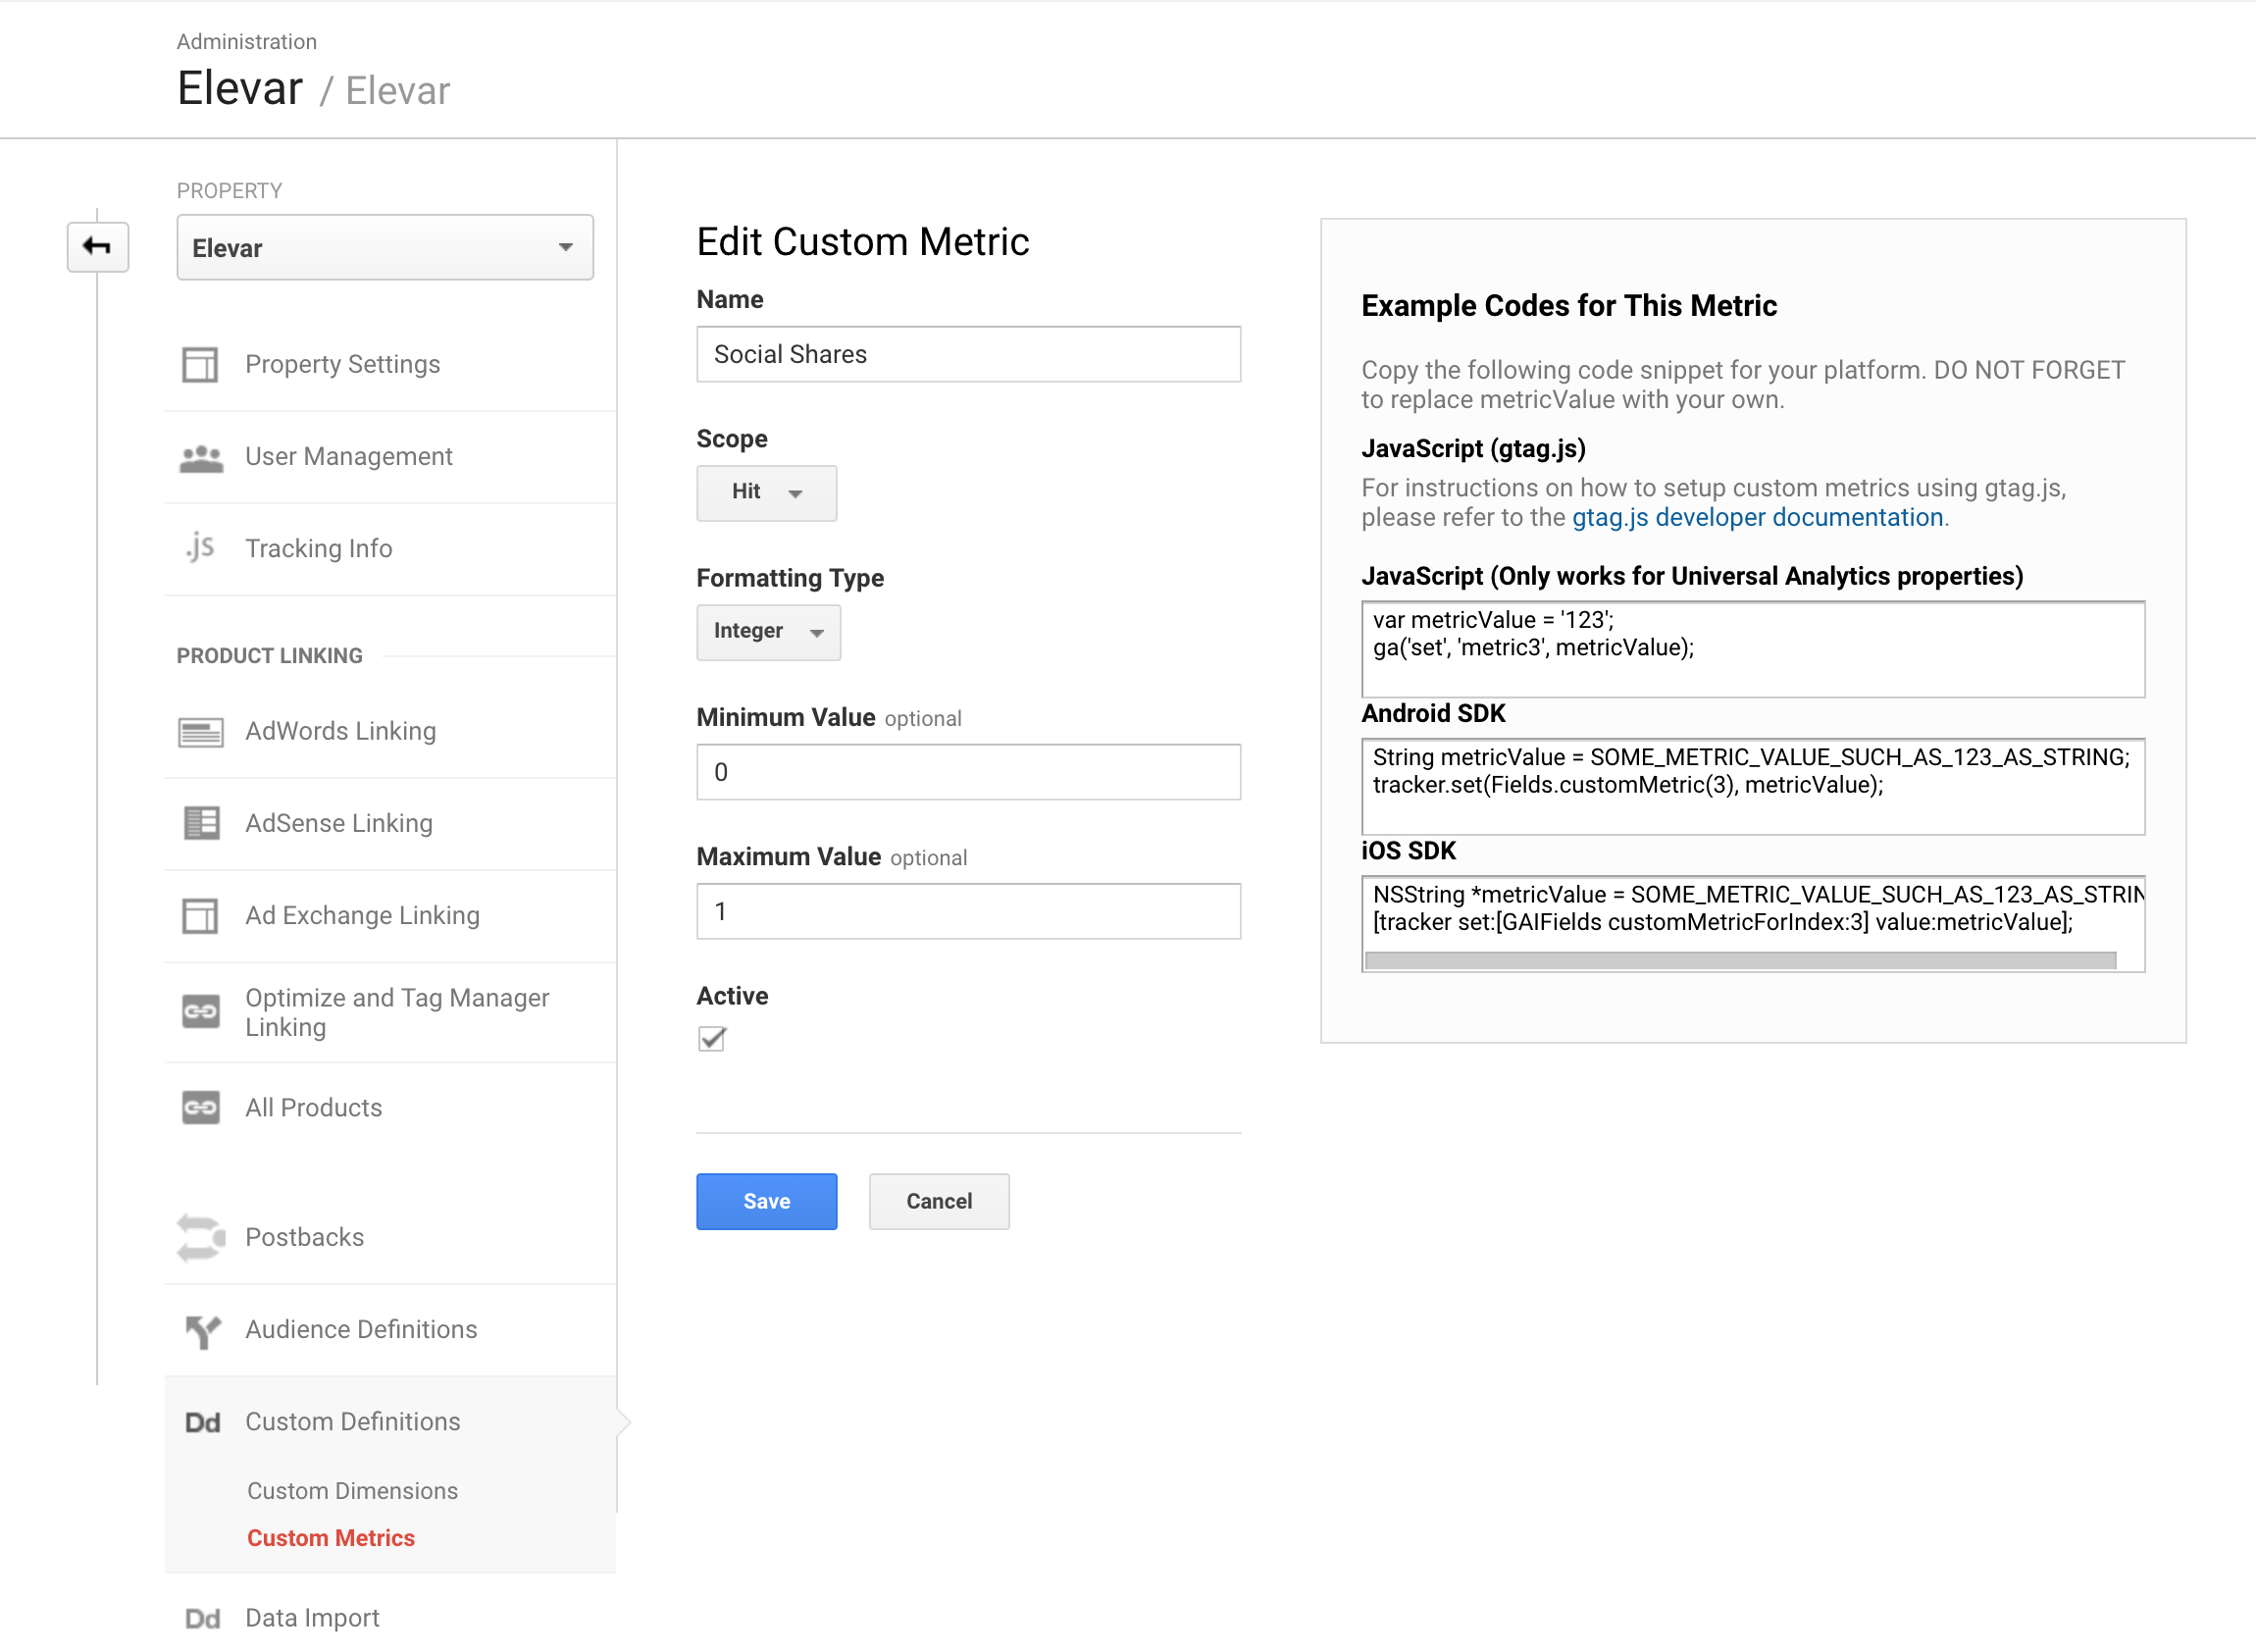
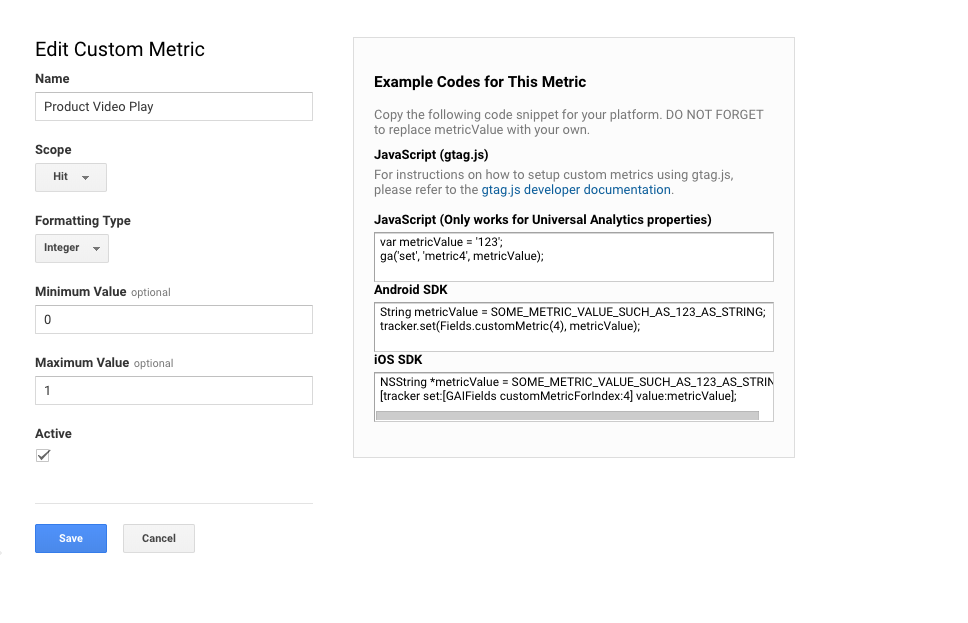
a) Create custom metric in Google Analytics
Go to Google Analytics > Property > Custom Definitions > Custom Metrics
Then create a new “hit” scoped metric with integer format and set the minimum value to 0 and max value to 1 like this:
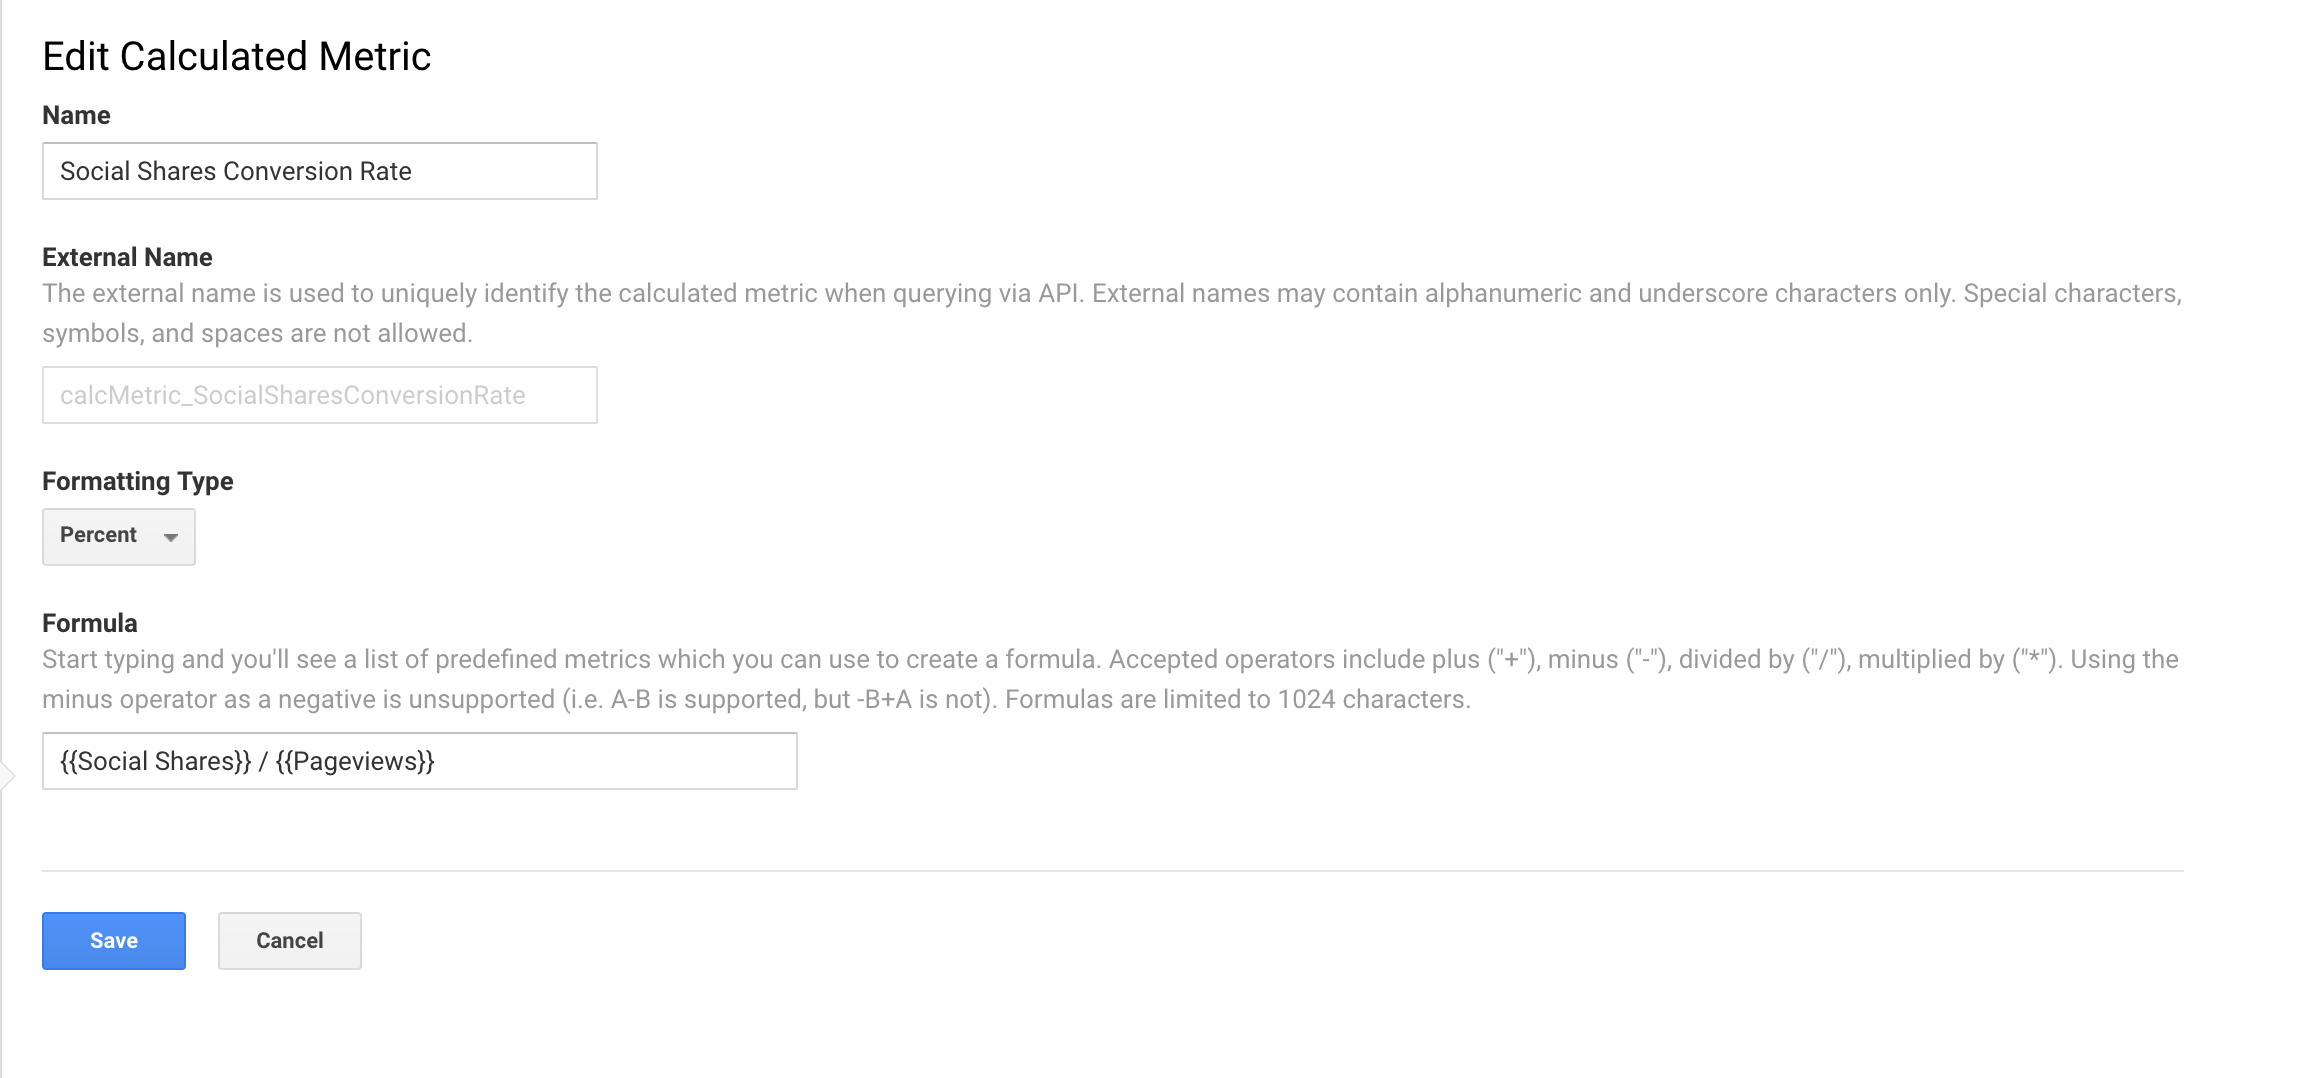
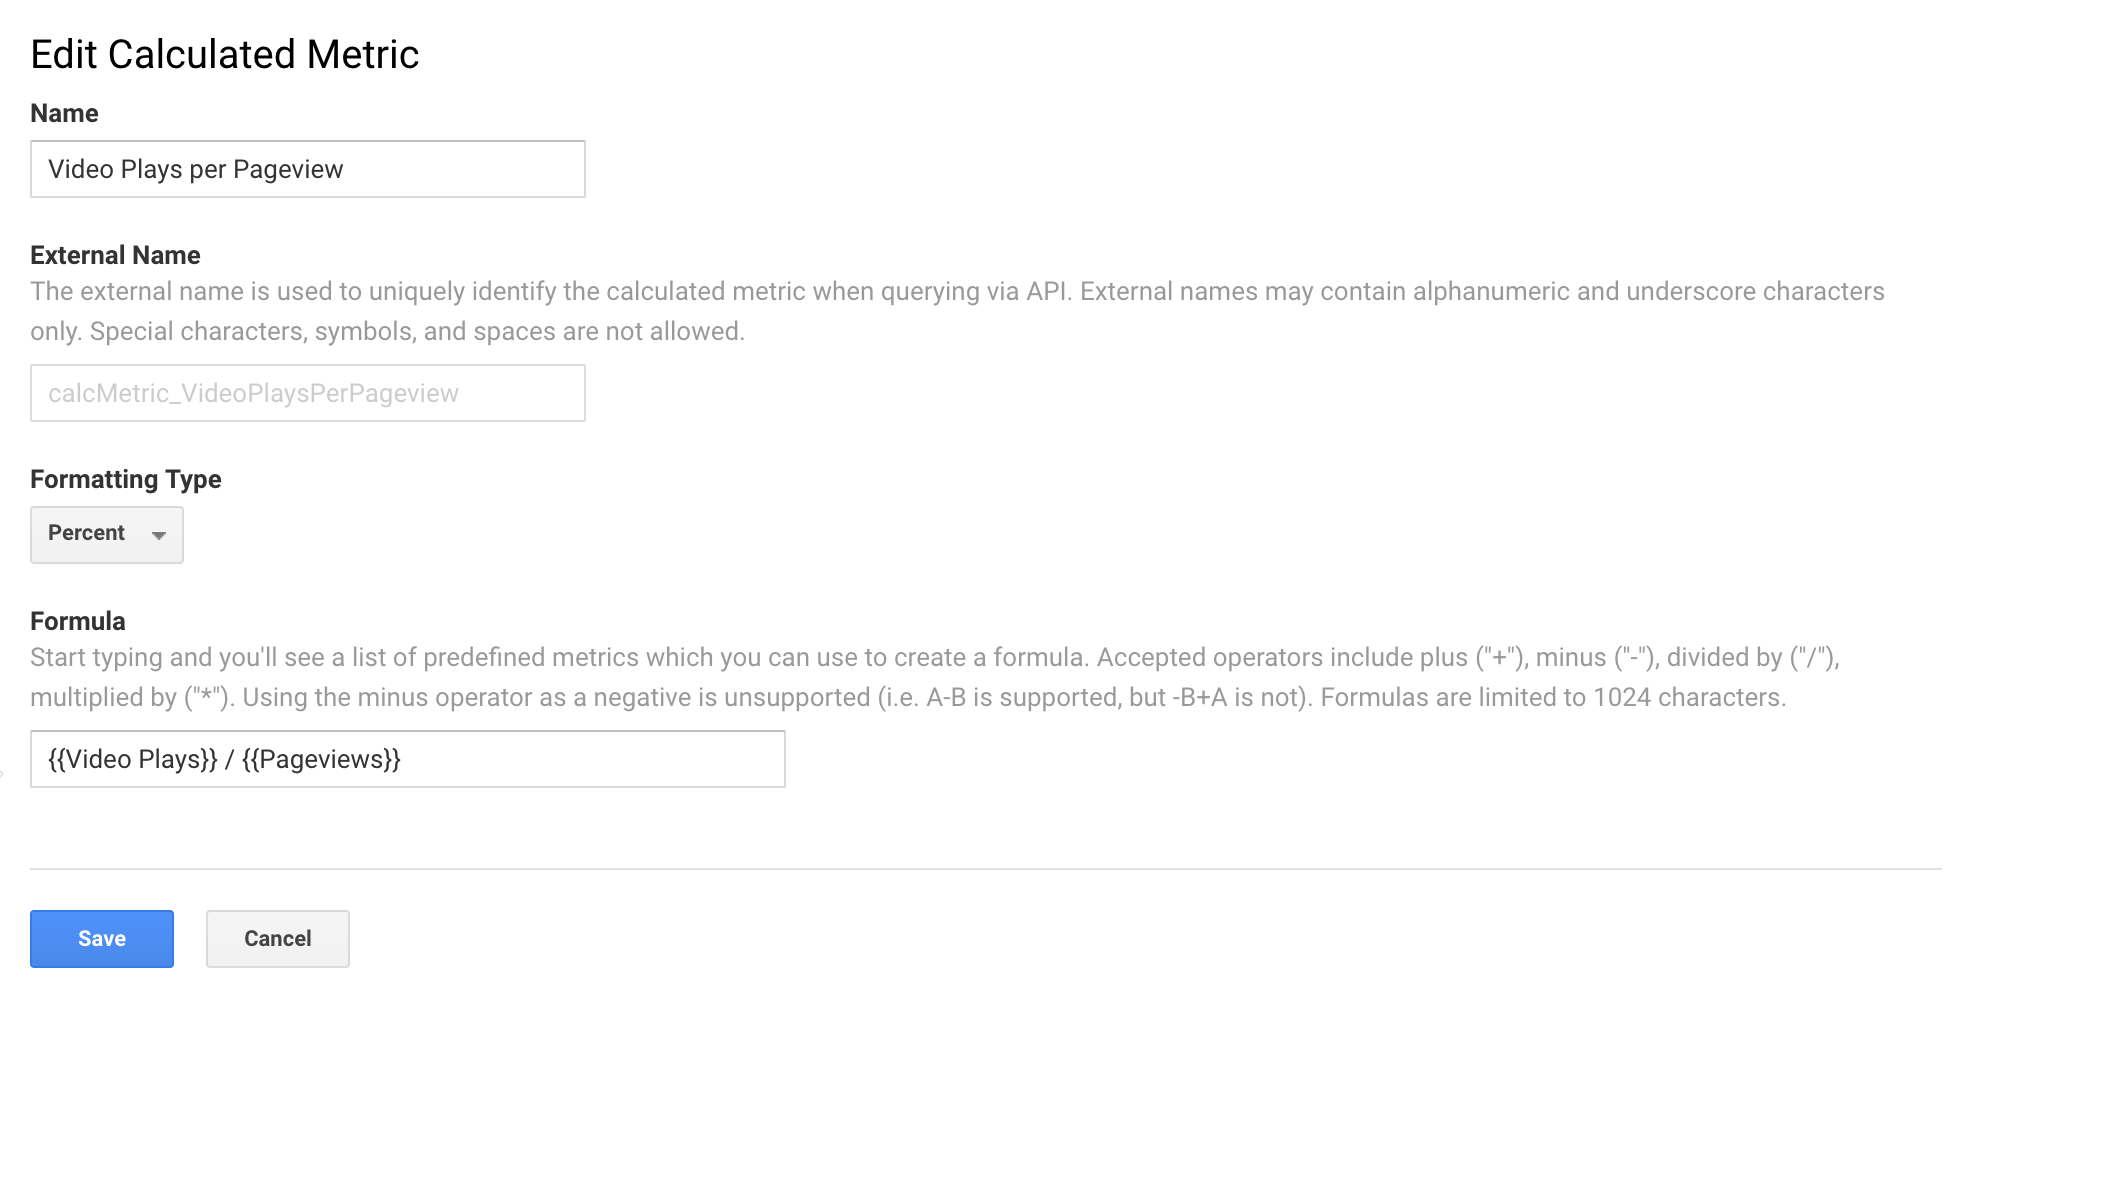
b) Create calculated metric in Google Analytics
Now we’re going to create a calculated metric using our new custom metric so we can get data like:
3.2% of all pageviews of this article result in a social share
Go to Google Analytics > View* > Calculated Metrics
Then create a new calculated metric by typing in the new custom metric you created in the previous step (Social Shares) and divide it by pageviews. You can just begin typing in this field and the autocomplete will kick in.
*note: calculated metrics must be created on each view that you would like to analyze these new metrics
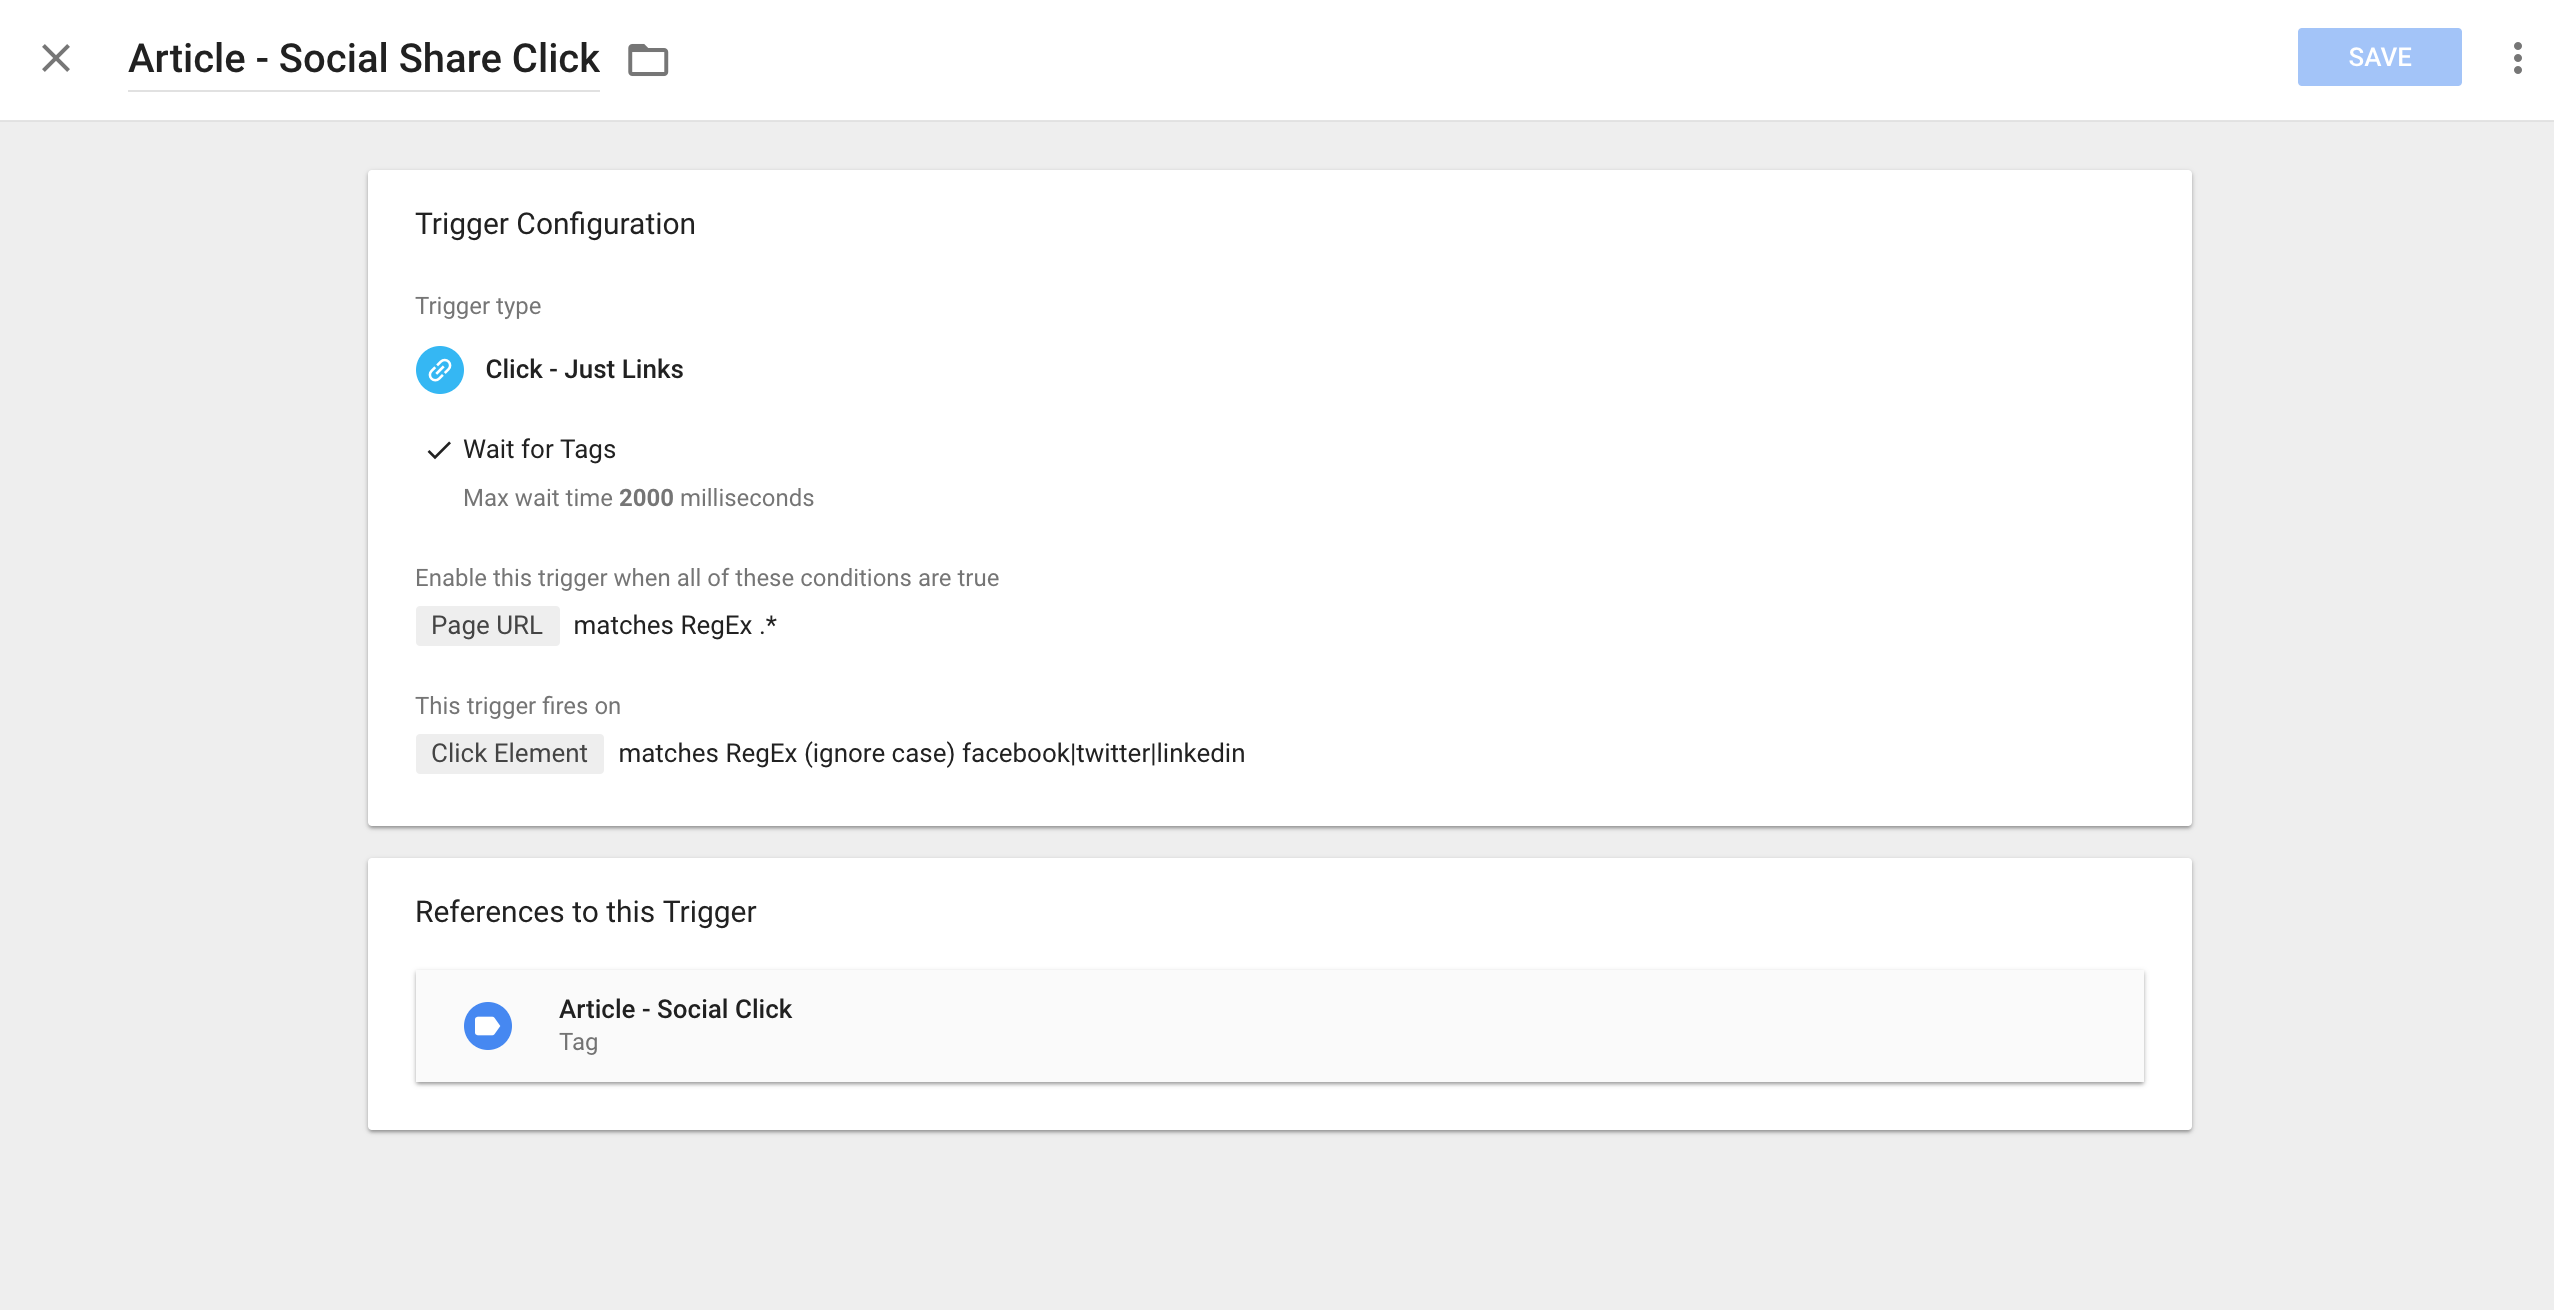
c) Create GTM trigger for social share actions:
Within Google Tag Manager I’ve chosen to create a trigger that targets any social share click as shown below.
Personally, I don’t care too much about the difference between Facebook, Twitter, or LinkedIn shares but in theory you could break these up.
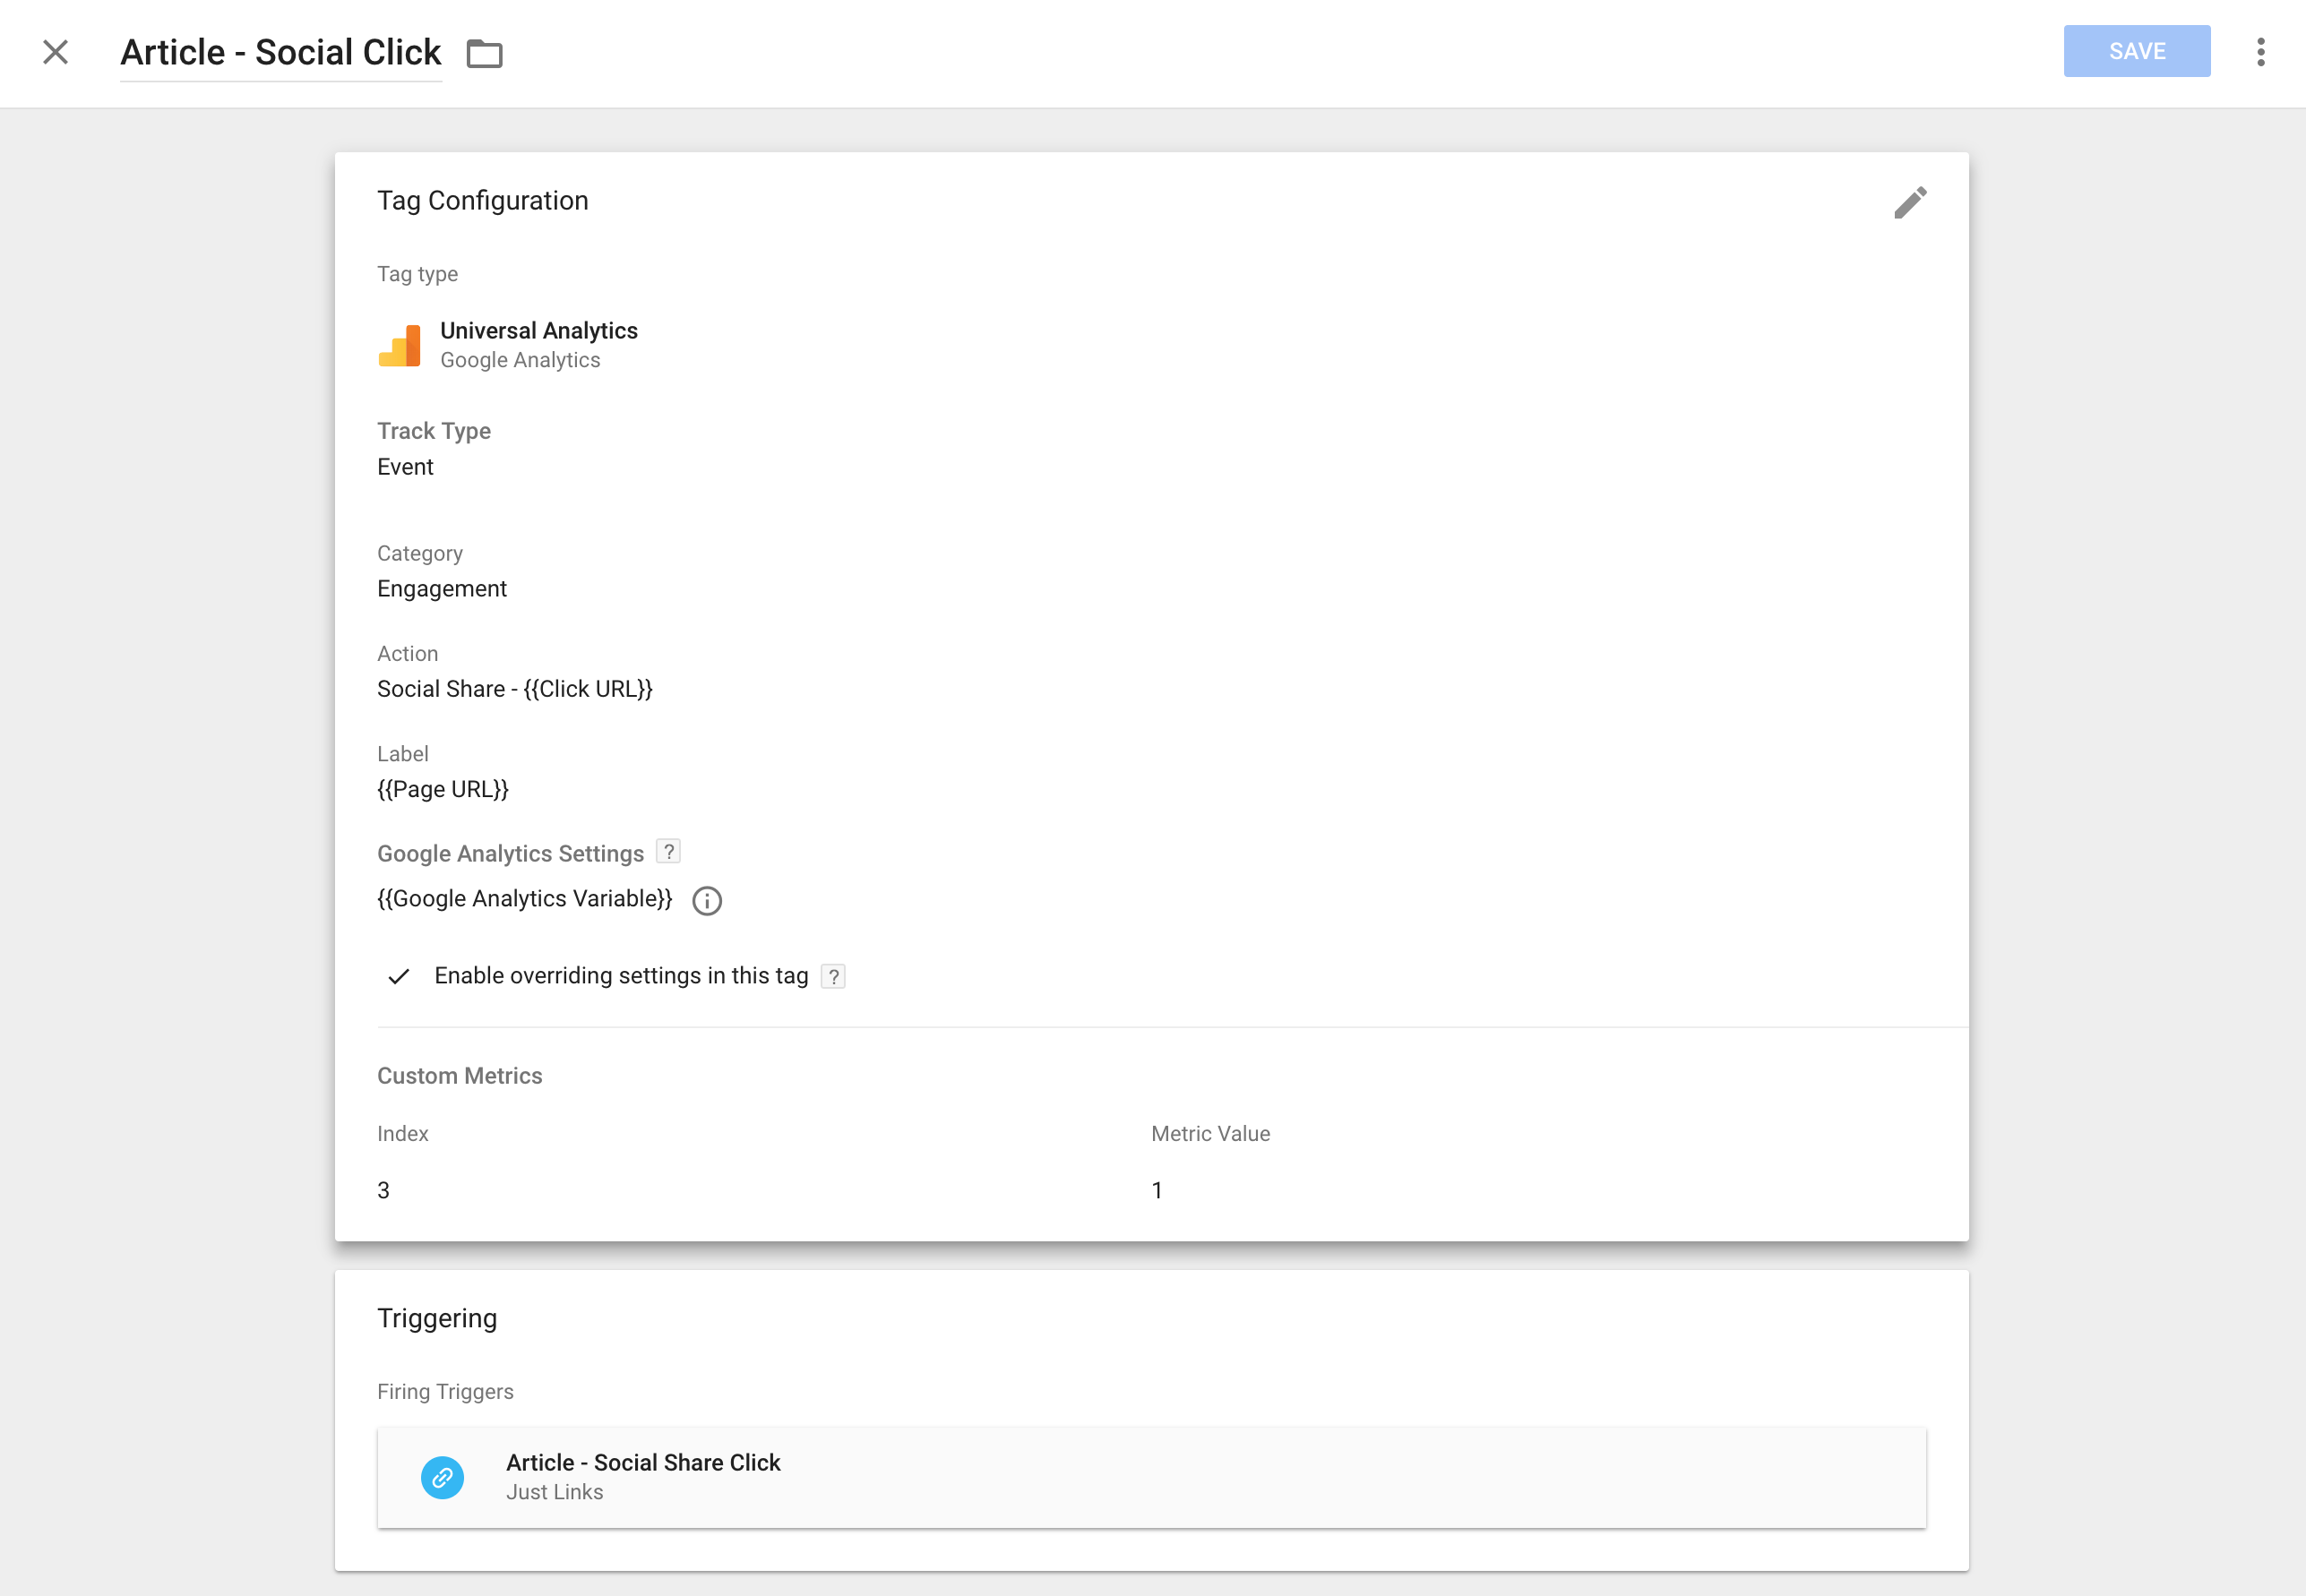
d) Create custom GTM event tags pushing hits to Google Analytics
Now we want to push an event hit to Google Analytics anytime a user clicks a social share button.
This is done with a Universal Analytics Event track type tag within GTM.
In this tag, I’ve chosen to set:
- Event Category: Engagement
- Event Action: Social Share – {{ Click URL }} which is a variable capturing the URL of the page being shared
- Event Label: {{ Page URL }} which is the page being shared!
- Google Analytics Settings: I have a native Google Analytics variable created that stores the bulk of my settings but for this specific hit we need to increment that fancy custom metric we created above in step a). Just enable overriding the setting in this tag as shown below, set the metric index (I show where to grab this below), and set the metric value to “1”. This just means anytime someone clicks to share then we’re incrementing the total # of times it’s been shared by 1.
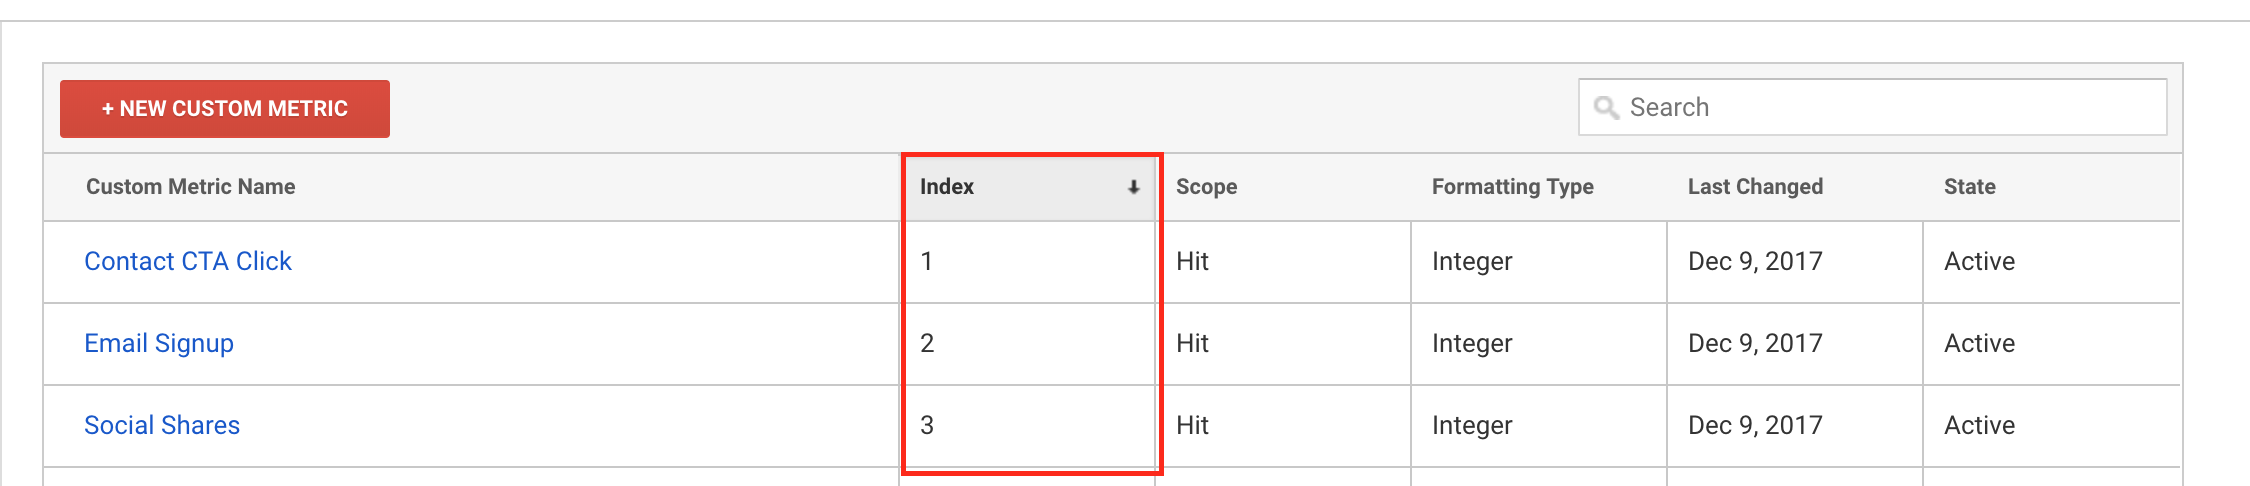
Here’s where to find the Index # in GA > Property > Custom Metrics:
e) Example Social Shares Report:
You now have access to this data within the Behavior > Custom Events reports and even better – you can add the custom metric and calculated metric to a plethora of different GA dimensions.
Inside Google Analytics custom reports, create a report with:
- Dimension: Page
- Metrics: Pageviews, Social Shares, and % of Social Shares per Page
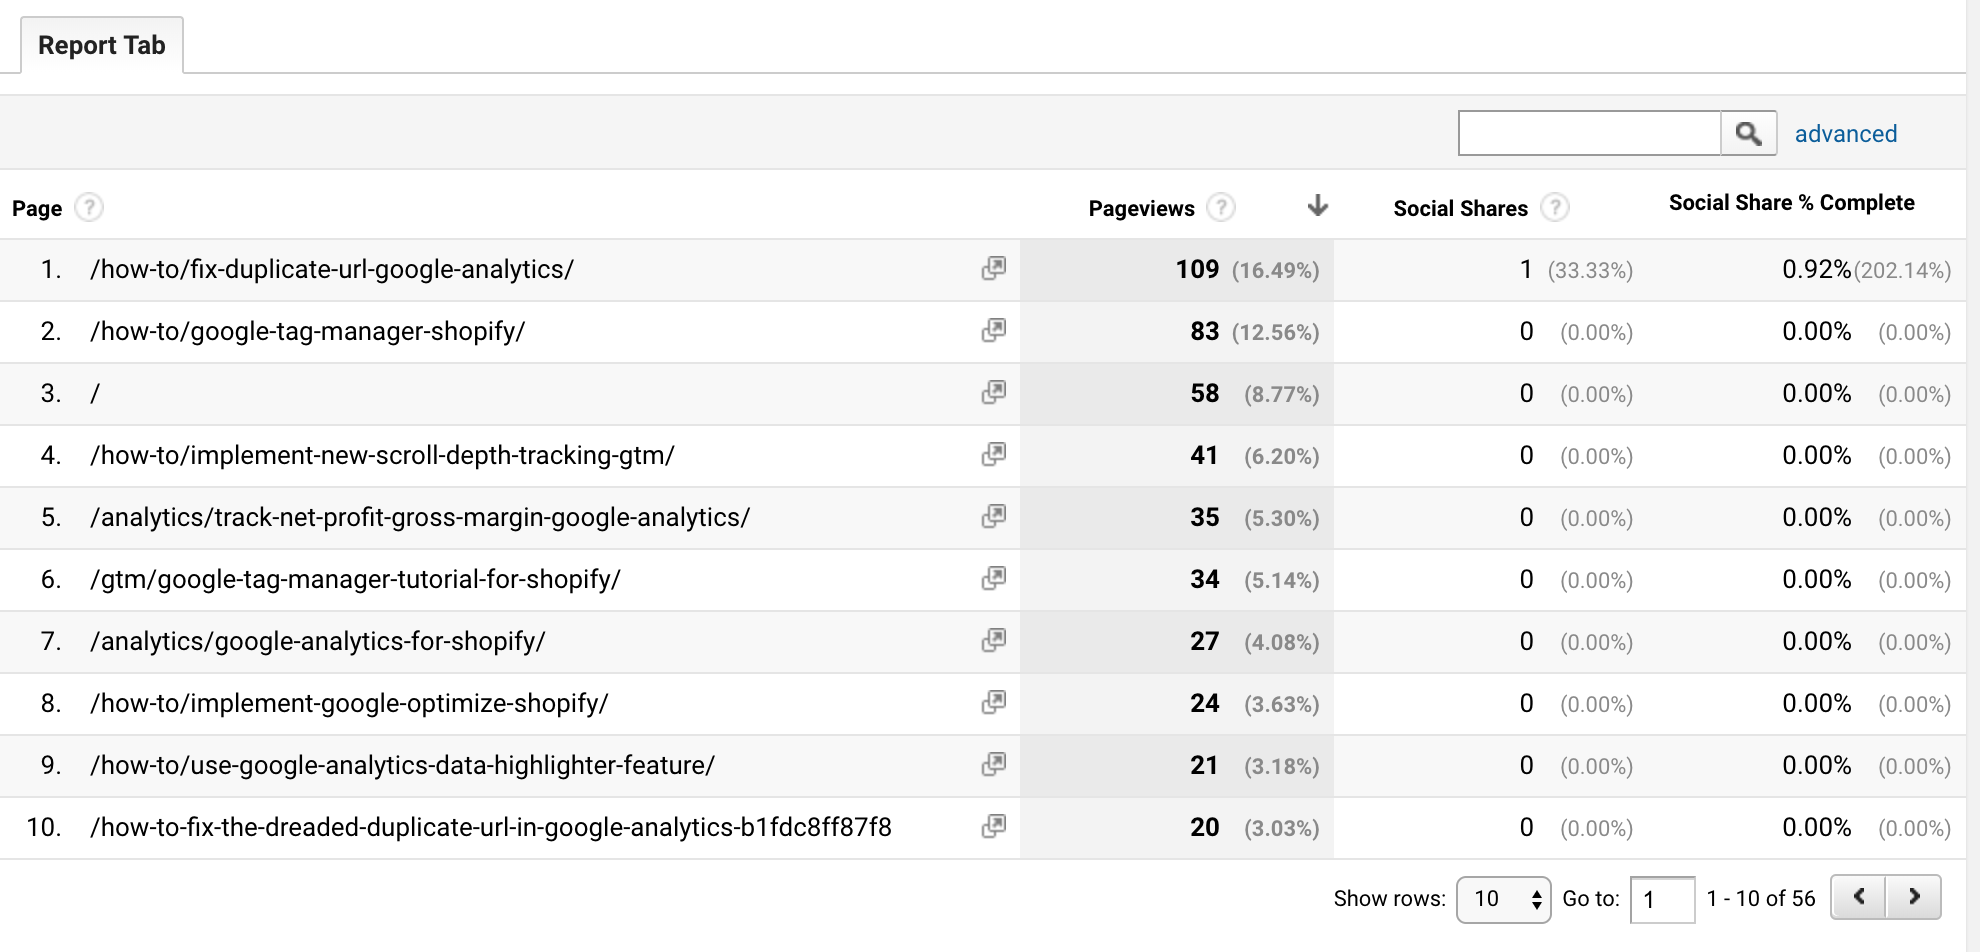
And here’s a custom events report:
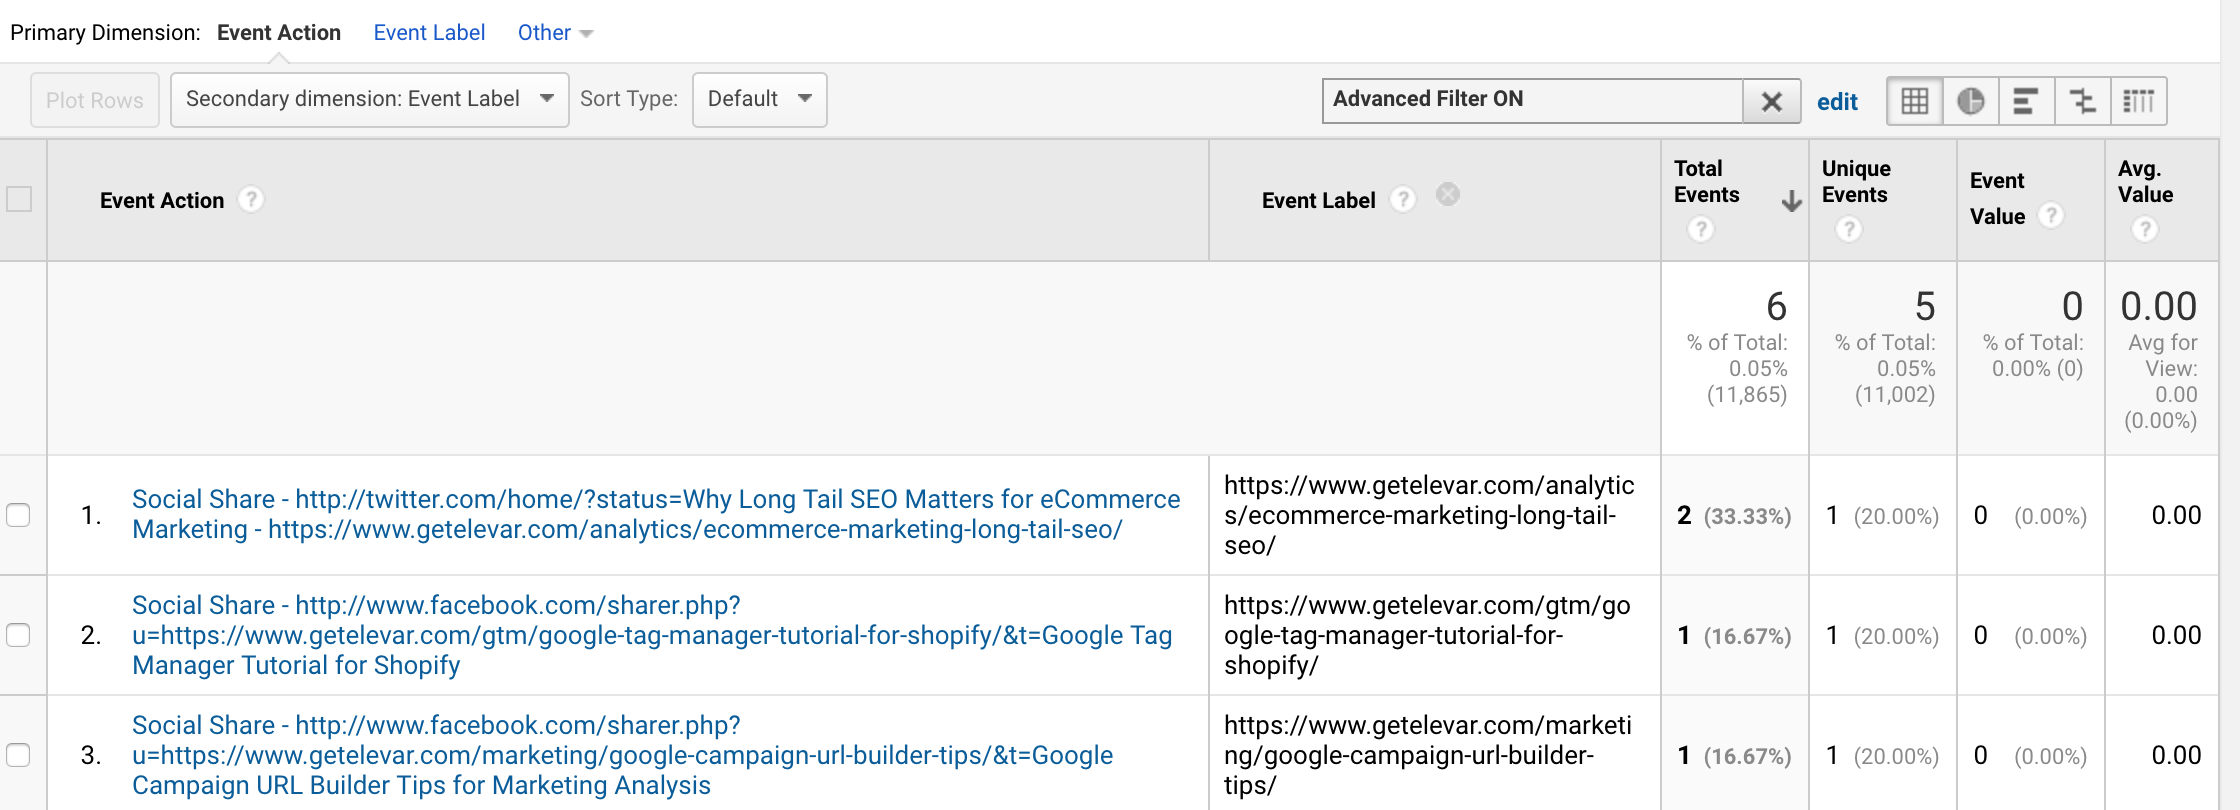
Doesn’t the first report look so much better than JUST viewing custom events hits? Especially when we start adding in revenue & conversion metrics 🙂
Note: Custom metrics don’t retroactively report on shares so you will have to wait for new data to begin propagating.
I need some more shares to make this report less pitiful…help a guy out by sharing this if you find it helpful 🙂
Video View Analytics
We’ll be setting this up with:
- Google Analytics custom metric
- Google Analytics calculated metric
- GTM native video trigger
- GTM custom event tag
- Google Analytics events
a) Create custom metric in Google Analytics:
Go to Google Analytics > Property > Custom Definitions > Custom Metrics
Then create a new “hit” scoped metric with integer format and set the minimum value to 0 and max value to 1 like this:
b) Create calculated metric in Google Analytics
Now we’re going to create a calculated metric just like we did for social shares so we can get data like this:
The segment of users who watched videos on this page resulted in 10x more assisted conversions and 3x more last-click conversions than non-video watchers.
Go to Google Analytics > View > Calculated Metrics
Then create a new calculated metric by typing in the new custom metric you created in the previous step (Video Plays) and divide it by pageviews. You can just begin typing in this field and the autocomplete will kick in.
c) Create GTM trigger for video plays
If you haven’t read my related guide on how to setup video tracking within Google Tag Manager, then I recommend reading this first. I show exactly how to create these video triggers.
In short, here are the steps needed to complete in GTM to start tracking video plays in Google Analytics:
- Enable the built-in variables for video plays
- Create a new trigger using the native trigger type of “YouTube Video”
- Publish a new event tag with the video trigger
Now – one difference from my how to guide that I recommend is creating two event triggers for video plays:
- One hit that only pushes an event the first time a video is started
- Hits that pushes an event for subsequent video actions (pause, completion, etc).
Why? If we’re trying to calculate the avg % of video plays per page, and we fire event hits every time a user starts (1 hit), stops (1 hit), completes video (1 hit) on the same page, then our % is not going to be accurate. 3 hits / 1 pageview = 300%!
Here’s my “start” only trigger configuration:
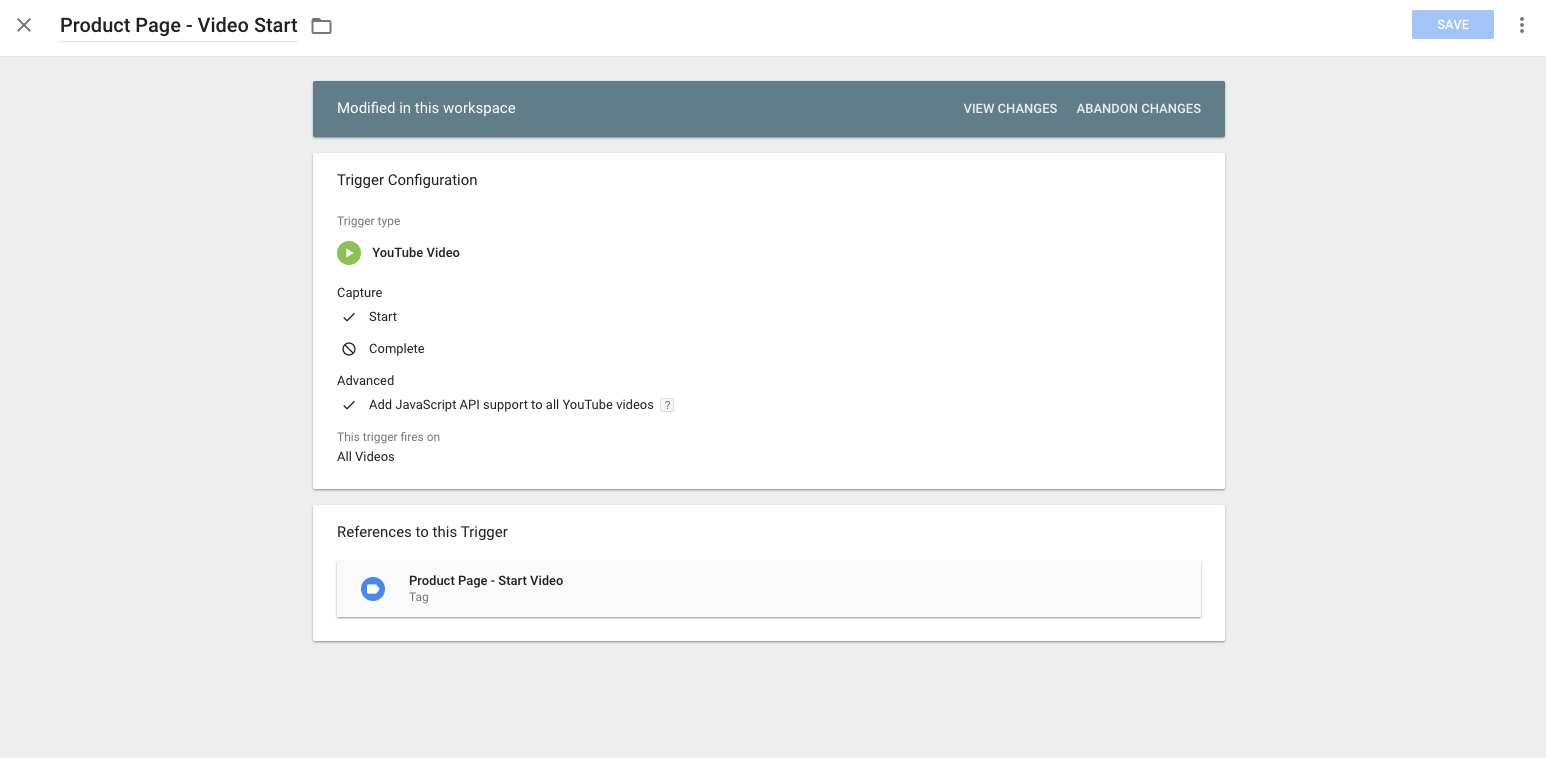
I’ll show you how to create your new event tag and send data to GA in the next step..
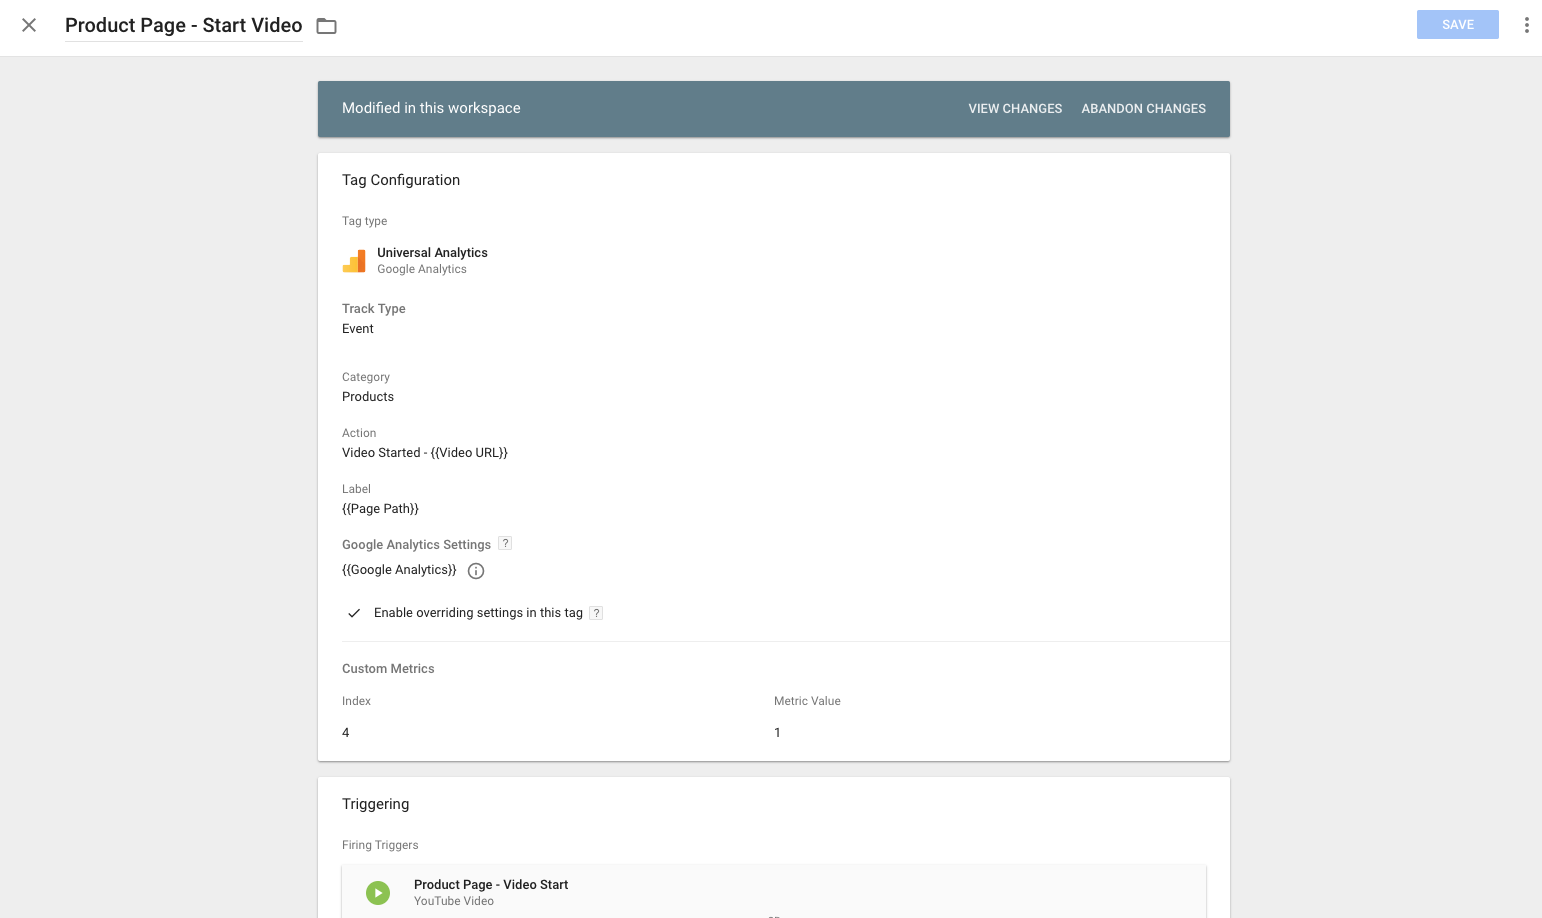
d) Create custom GTM event tags pushing hits to Google Analytics
Now we want to push a hit to Google Analytics anytime a user initiates a video play.
This is done with a Universal Analytics Event track type tag within GTM.
In this tag, I’ve chosen to set:
- Event Category: Products
- Event Action: Video Started – {{ Video URL }} which is a variable capturing the URL of my video
- Event Label: {{ Page Path }} or {{ Page URL }} which is the page where the video play occurs
- Google Analytics Settings: I’m using my native Google Analytics variable again here with the same override process. Just enable overriding the setting in this tag as shown below, select the metric index, and set the metric value to “1”. This means anytime someone clicks to play a video then we’re incrementing the total # of times it’s been played by 1.
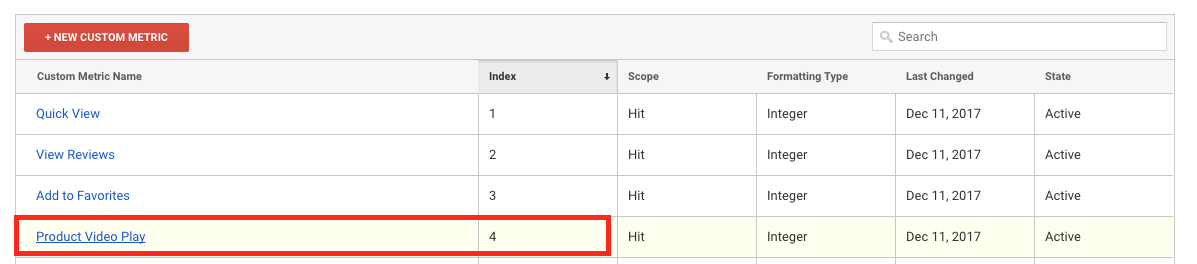
Here’s where to find the Index # in GA > Property > Custom Metrics:
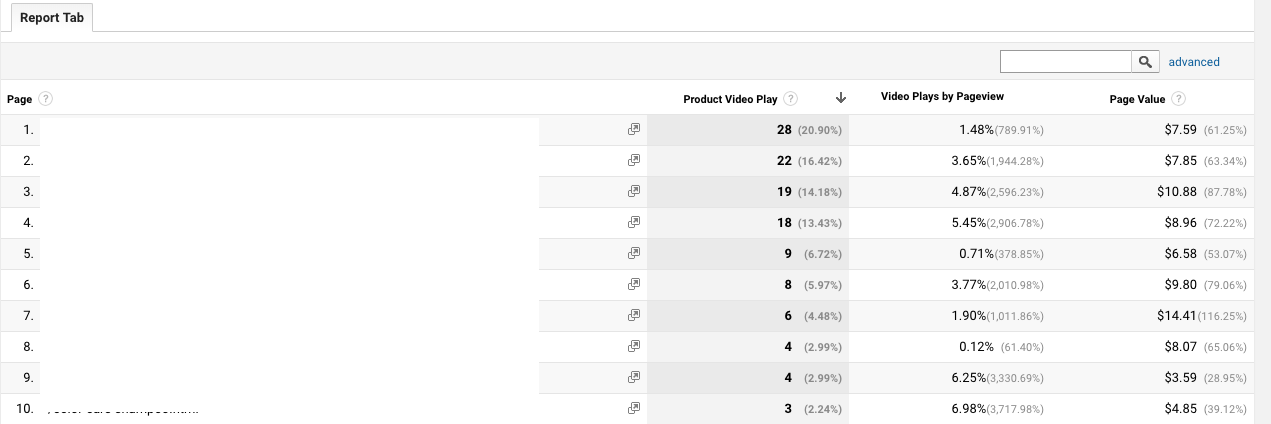
e) Example Video Plays Report:
You now have access to this data within the Behavior > Custom Events reports and can add the custom & calculated metric to a plethora of different dimensions.
Inside Google Analytics custom reports, create a report with:
- Dimension: Page
- Metrics: Pageviews, Video Plays, and % of Video Plays per Page, along with other metrics like page value, etc.
One other variation with this custom metric would be making this a product scoped dimension so we can plot this data alongside the product SKU conversion path.
Email Signup Analytics
We’ll be setting this up with:
- Google Analytics custom metric
- Google Analytics calculated metric
- GTM custom trigger(s)
- GTM custom event tag(s)
- Google Analytics events
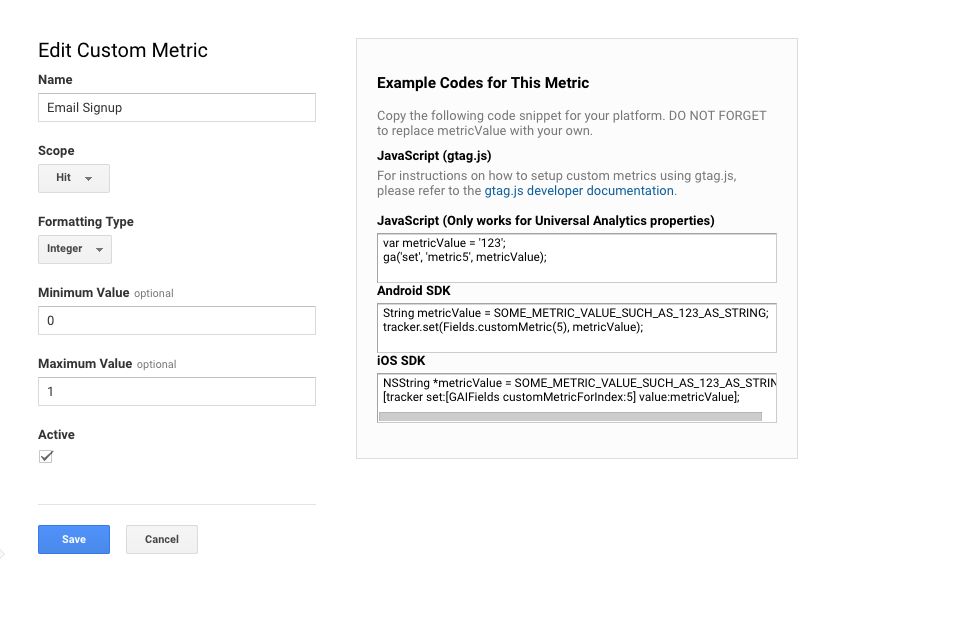
a) Create custom metric in Google Analytics:
Go to Google Analytics > Property > Custom Definitions > Custom Metrics
Then create a new “hit” scoped metric with integer format and set the minimum value to 0 and max value to 1 like this:
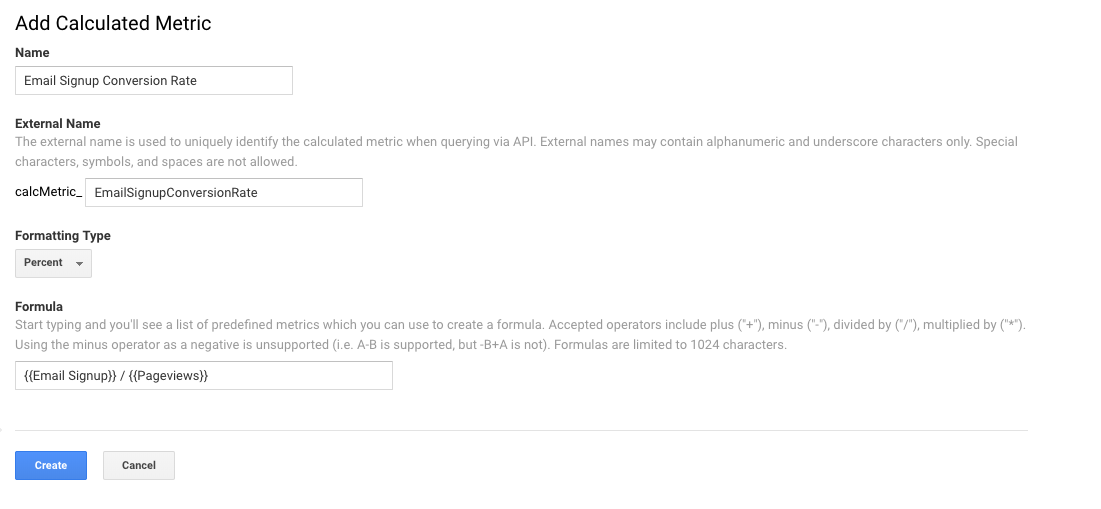
b) Create calculated metric in Google Analytics
Now we’re going to create a calculated metric using our new custom metric so we can get data like:
For every 100 pageviews of this product, 3% purchased and 1% signed up for email (to receive discount, etc)
Go to Google Analytics > View > Calculated Metrics
Then create a new calculated metric by typing in the new custom metric you created in the previous step (Email Signups) and divide it by pageviews.
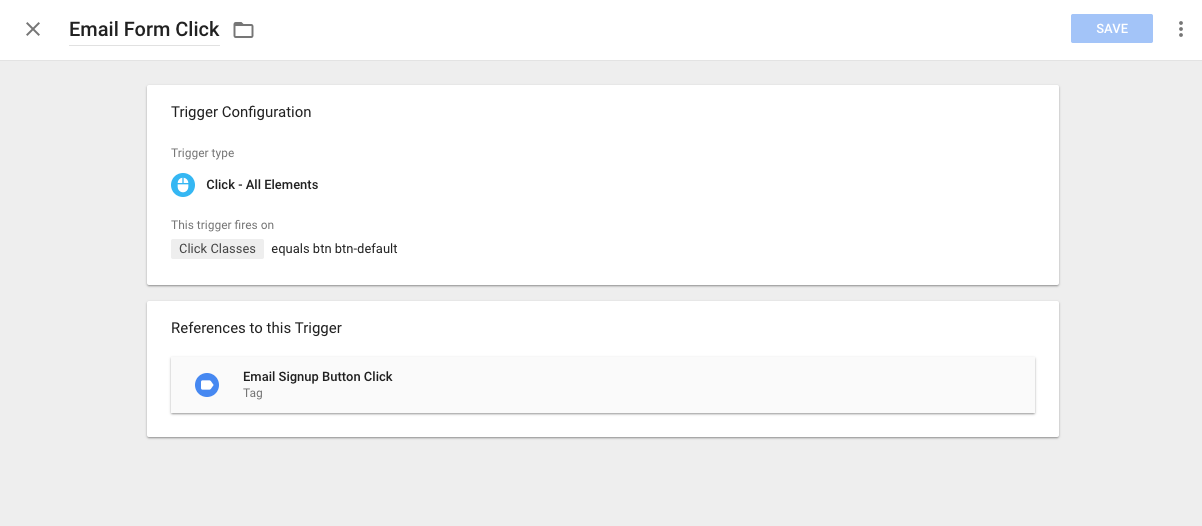
c) Create GTM trigger for email signups:
If you’re like most sites today then you probably have multiple areas where visitors can sign up for emails.
- Modal overlays
- Footers
- Exit intent
- Out of stock signups
- etc
So you will most likely need to create multiple triggers to capture these within GTM. Here’s how to find click classes for GTM tags specific to your site.
I’ll show one example from this site:
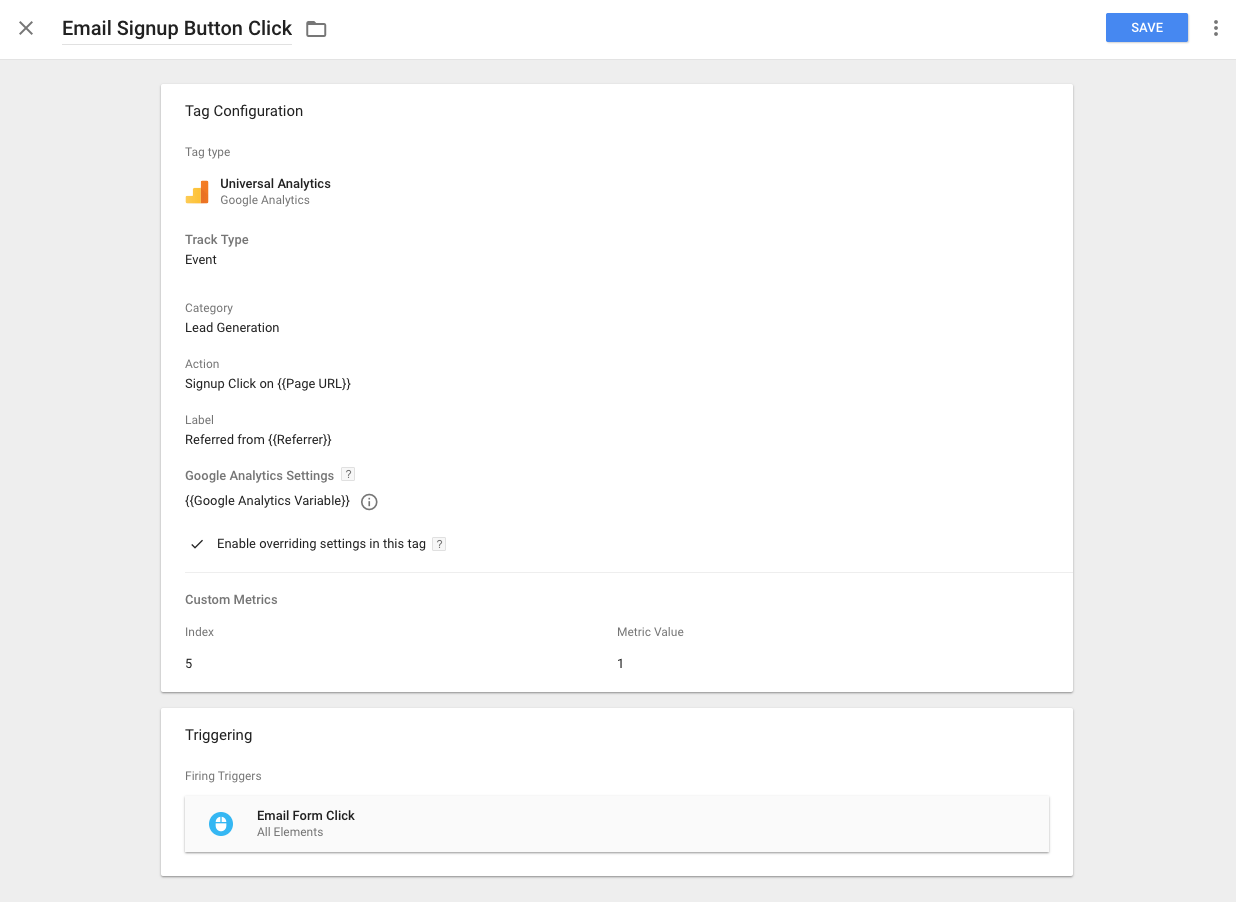
d) Create custom GTM event tags pushing hits to Google Analytics
Once you’ve created one or more of your email triggers then it’s time to push these hits to Google Analytics.
Surprise, surprise, this is done with a Universal Analytics Event track type tag within GTM.
In this tag, I’ve chosen to set:
- Event Category: Lead Generation (remember, this is likely to be different for you. If it’s a product page specific email signup then this could be Products).
- Event Action: Signup Click on {{ Page URL }} which is a variable capturing the URL where the signup occurs
- Event Label: Referred from {{Referrer}} which is a variable showing the referrer passed in the header. If this is a landing page event then it could “google.com”, or if it’s from a multi-pageview visit then it’ll be the previous page URL.
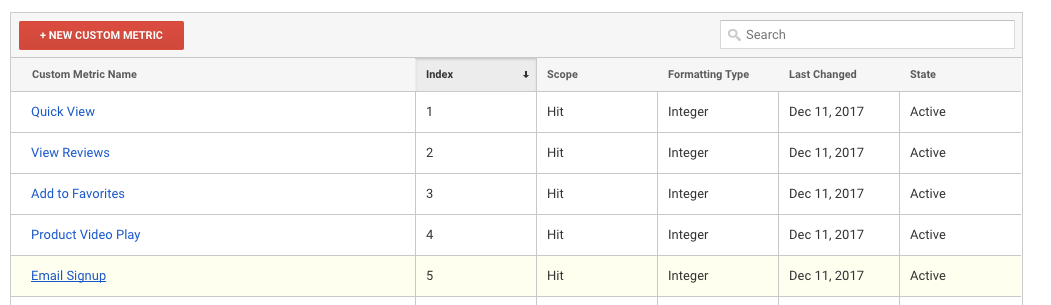
- Google Analytics Settings: Same process here as previous examples – just enable overriding the setting in the tag as shown below, select the metric index, and set the metric value to “1”. This just means anytime someone clicks email signups then we’re incrementing the total # of times by 1.
Here’s where to find the Index # in GA > Property > Custom Metrics:
Example Email Signups Report:
You now have access to this data within the Behavior > Custom Events reports and even better – you can add the custom metric to a plethora of different dimensions.
Inside Google Analytics custom reports, create a report with:
- Dimension: Page
- Metrics: Pageviews, Email Signups, and Email Signup Conversion Rate
And here’s a report using a custom dimension for category:
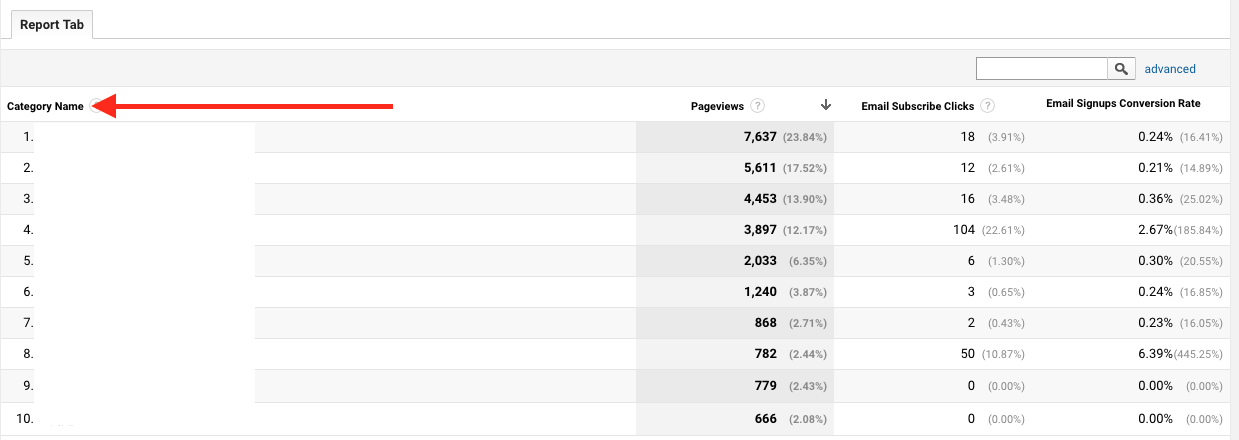
See how I just snuck that in there!
Custom metrics + custom dimensions = some real #datanerd reporting coming together.
Keep reading for custom dimension setup below 🙂
Promo Callouts / Impression Analytics
Let’s say you have inline promo banners on your blog pages driving traffic to various category or sale promo pages.
Or even driving traffic to other partner websites.
Wouldn’t it be great to report on the total # of times this banner was displayed within the user viewport (i.e. it’s visible on screen) and compare to # of clicks of that promo?
A good comparison is the “View Through” conversion that Google reports on for display marketing.
That’s what this example will show you how to create.
We’ll be setting this up with (big surprise here..):
- Google Analytics custom metric
- Google Analytics calculated metric
- GTM custom triggers
- GTM custom event tag
- Google Analytics events
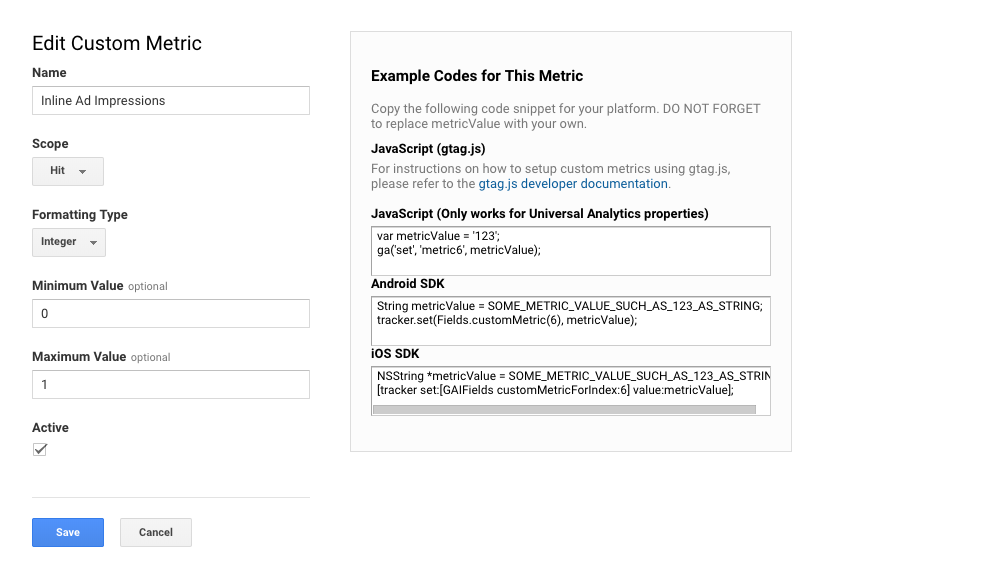
a) Create custom metric in Google Analytics
Go to Google Analytics > Property > Custom Definitions > Custom Metrics
Then create a new “hit” scoped metric with integer format and set the minimum value to 0 and max value to 1 like this:
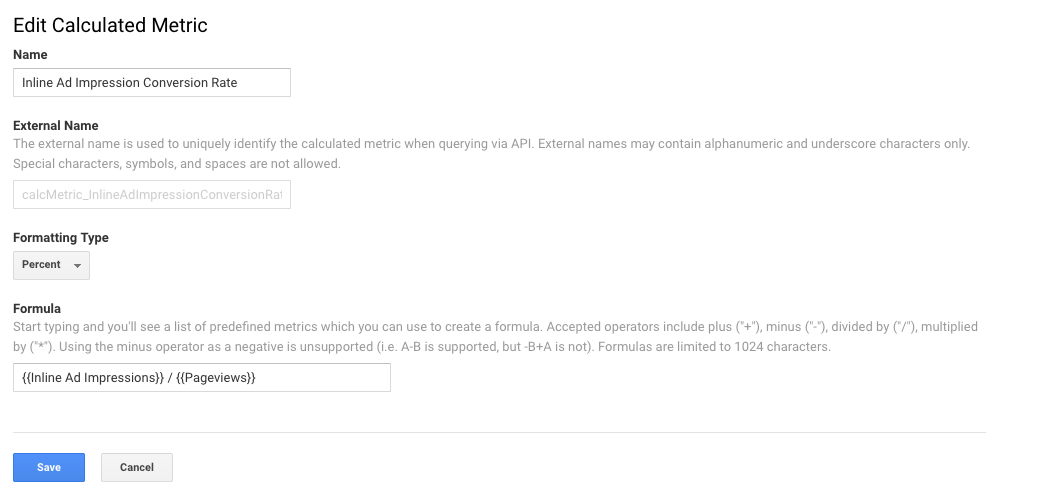
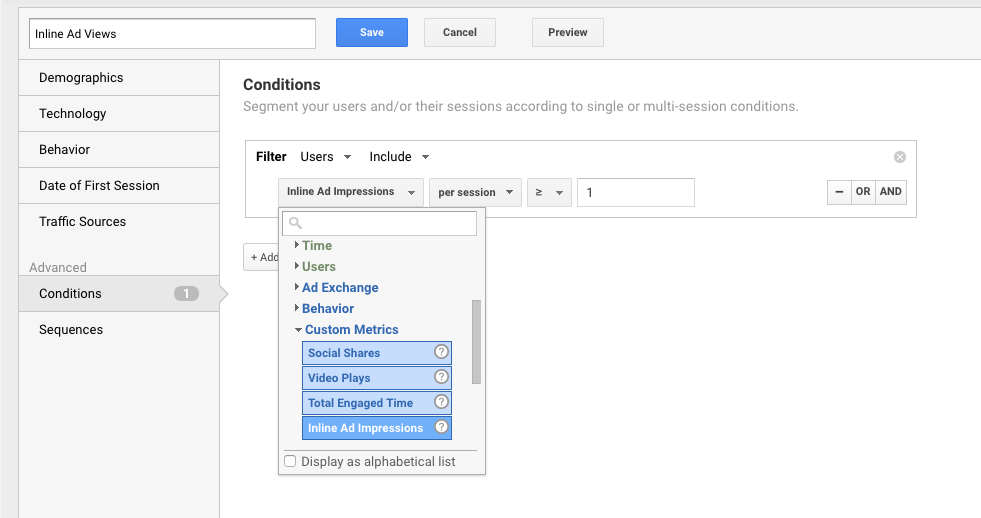
b) Create calculated metric in Google Analytics
Create a calculated metric using our new custom metric so we can get data like:
5,632 users viewed our promotion during Dec 1 – 31; and placement A converted 3x > placement B.
Go to Google Analytics > View > Calculated Metrics
Then create a new calculated metric by typing in the new custom metric you created in the previous step (Inline Ad Impressions) and divide it by pageviews.
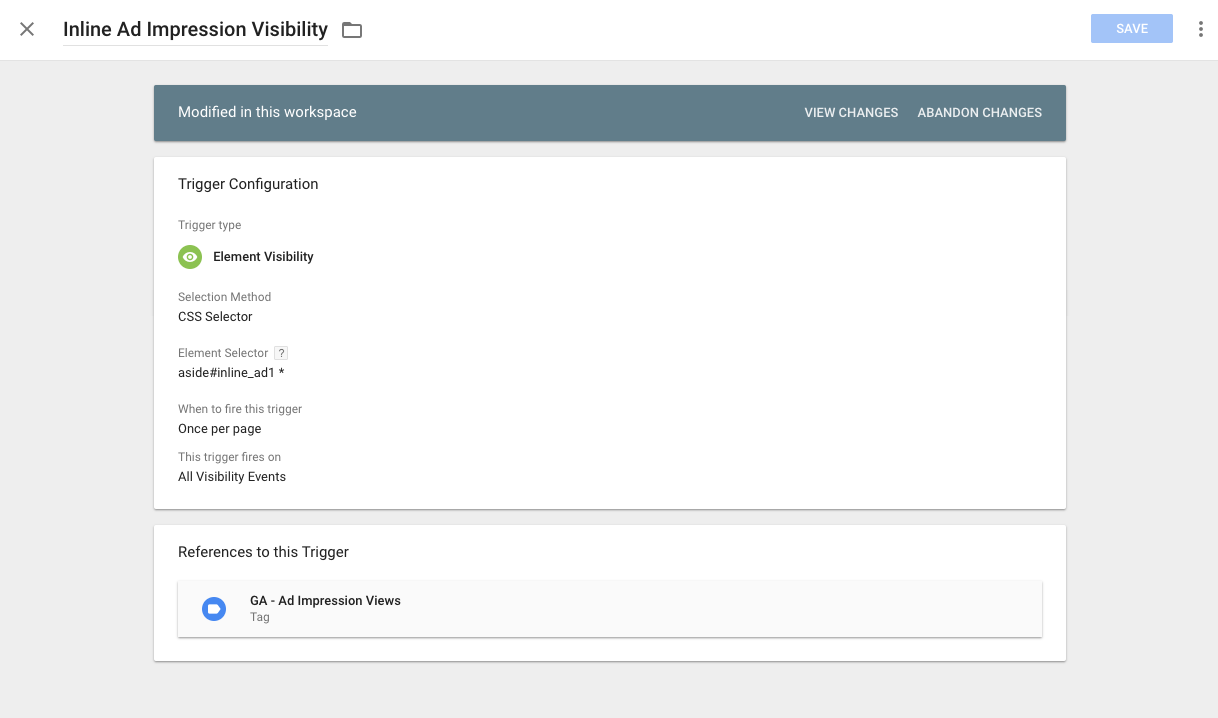
c) Create GTM trigger for promo performance:
This requires utilizing the native Visibility trigger within Google Tag Manager. It’s really cool!
If you haven’t read my how-to guide on visibility trigger creation then I highly recommend prior to attempting to create your own promo event tags.
Here’s an example of a trigger I have that fires anytime a promo banner is visible in a user viewport:
d) Create custom GTM event tag pushing hits to Google Analytics
Now we want to push a hit to Google Analytics anytime your promotion makes it into a user’s viewport.
This is done with a Universal Analytics Event track type tag within GTM.
In this tag, I’ve chosen to set:
- Event Category: content interaction
- Event Action: ad view – {{ Inline Ad URL }} which is a custom variable that I created capturing the click URL of the ad
- Event Label: {{ Page URL }} which is the page where the ad was viewed
- Non-Interaction Hit: True which means these events won’t effect bounce rate
- Google Analytics Settings: Same process as previous steps here – enable overriding the setting in this tag as shown below, set the metric index, and set the metric value to “1”. This just means anytime the promo ad is viewed it increments by 1.

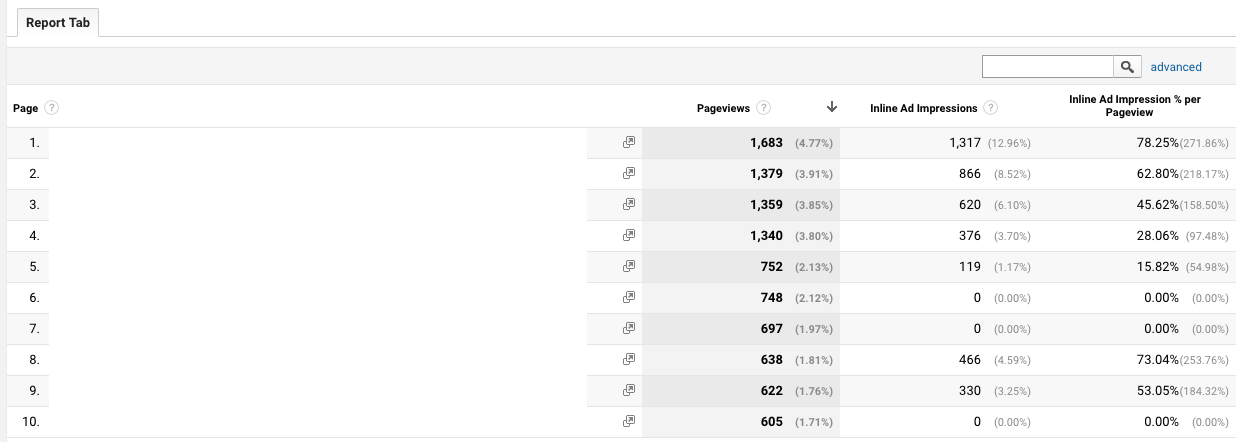
e) Example Promo Performance Report:
Here are two reports I’ve created as examples with one utilizing custom segments I’ve created with this new data at my fingertips.
Inside Google Analytics custom reports, create a report with:
- Dimension: Page
- Metrics: Pageviews, Inline Ad Views, and Inline Ad Impression per Pageview (your calculated metric)
And here’s one where I’ve created two segments to compare to one another against my sitewide goal completions:
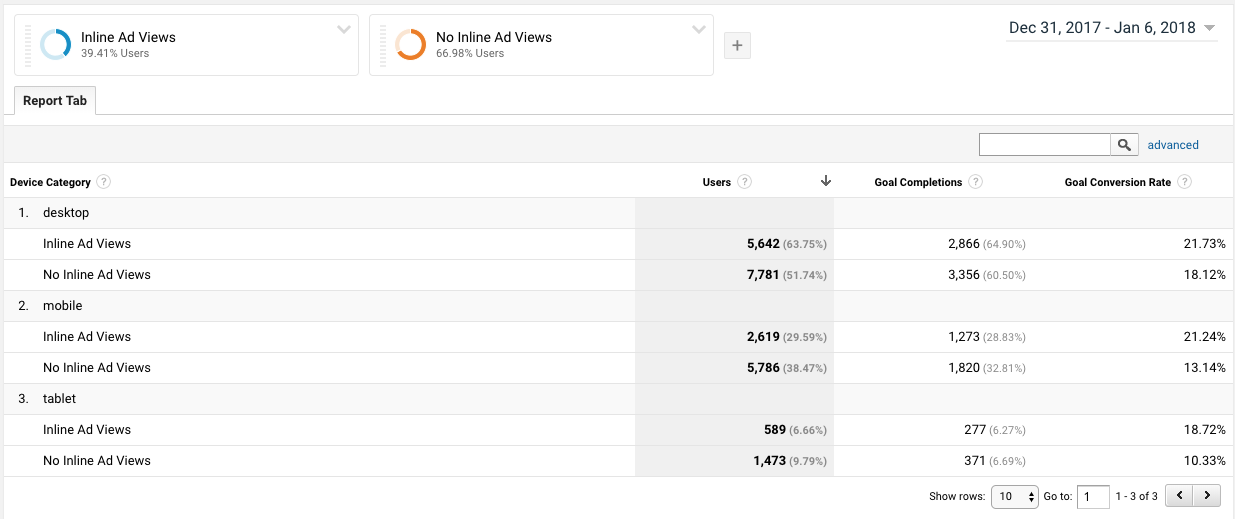
You can see the segment of users that view our ads achieve our goals at significantly higher rate, especially mobile!
Here’s how I created one of the segments with the other just the opposite.
#datanerd excitement at the possibilities this unlocks for a/b testing promo placement.
Scroll Depth Analytics
If you haven’t been living under a rock the past couple of years, this seemed like it was the hottest data that you should be capturing on your site.
Here is my guide on how to set up scroll depth tracking using the native GTM triggers and variables in less than 5 minutes.
For me, I’m interested in seeing the % of pageviews that result in 100% completion (i.e. how many people read the entire article).
Why? This is where email signup forms or even promotions for our own product are. So if people don’t reach the end then these aren’t likely to perform very well!
So to get this 100% completion metric, we’re going to use:
- Google Analytics custom metric
- Google Analytics calculated metric
- Native GTM variables and trigger
- GTM custom event tag
- Google Analytics events
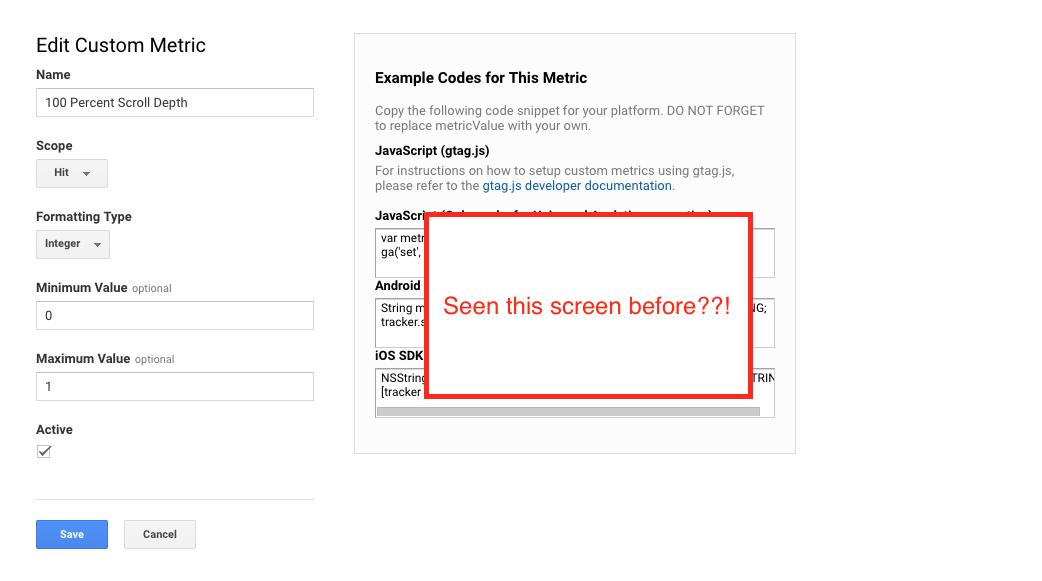
a) Create custom metric in Google Analytics:
Go to Google Analytics > Property > Custom Definitions > Custom Metrics
Then create a new “hit” scoped metric with integer format and set the minimum value to 0 and max value to 1 like this:
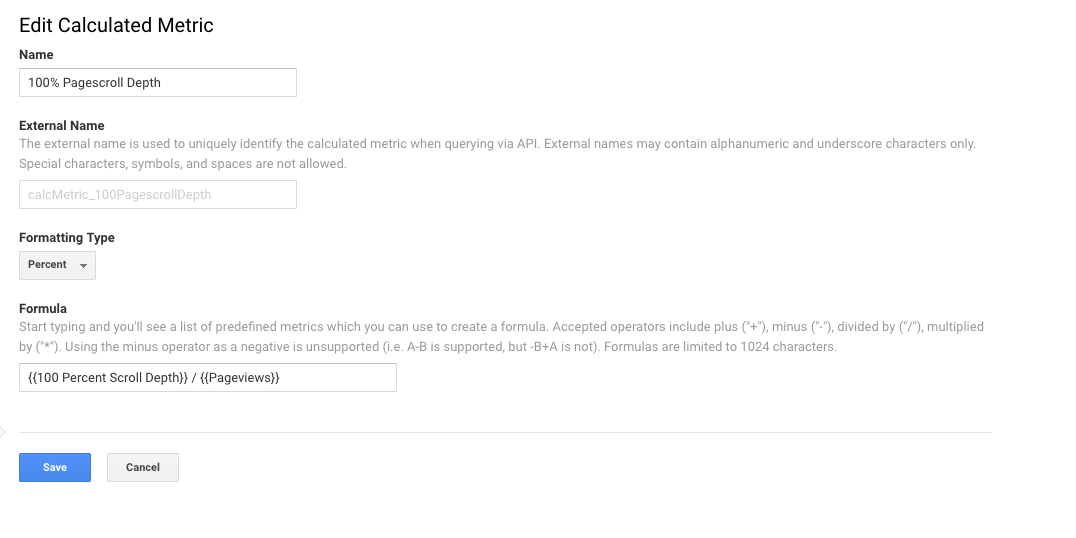
b) Create calculated metric in Google Analytics
Create a calculated metric using our new custom metric so we can get data like:
56% of all users scrolled to the end of the page.
Go to Google Analytics > View > Calculated Metrics
Then create a new calculated metric by typing in the new custom metric you created in the previous step (Inline Ad Impressions) and divide it by pageviews.
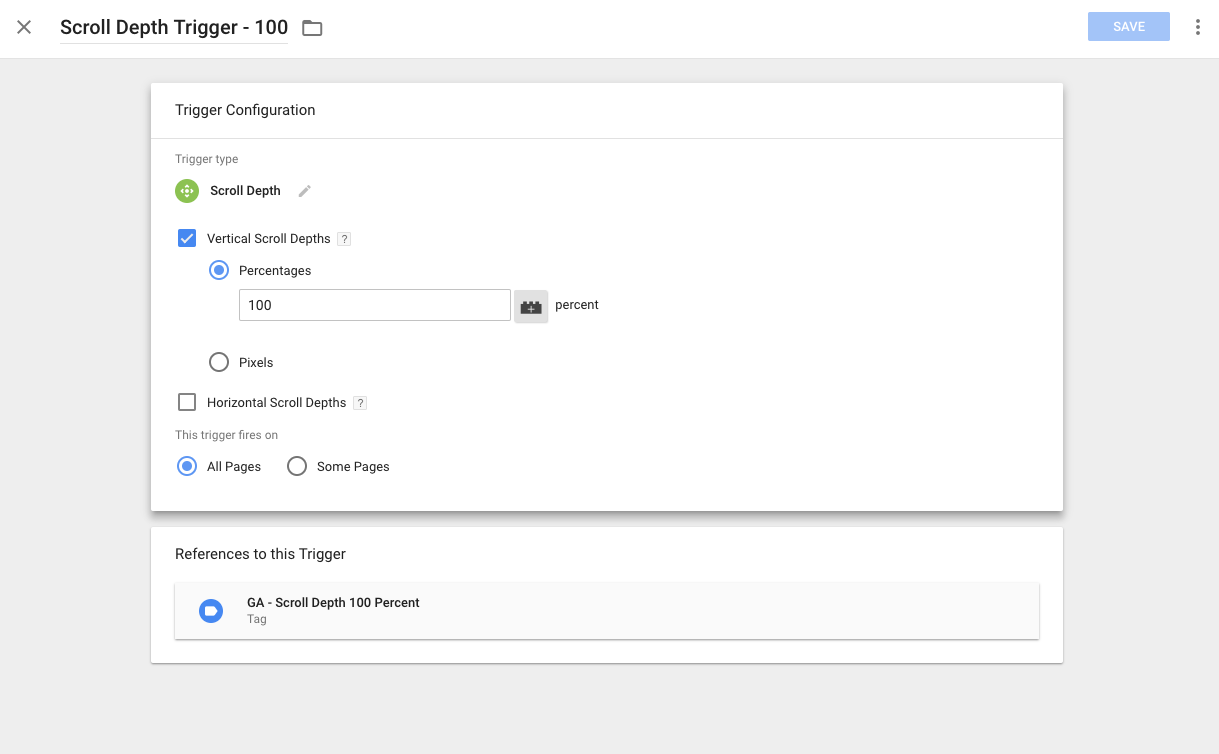
c) Create trigger for 100% scroll depth completion:
This requires utilizing the native scroll depth variables and trigger within Google Tag Manager (link to my guide here again).
Here’s an example of a trigger I have that fires when a user reaches the end of the page:
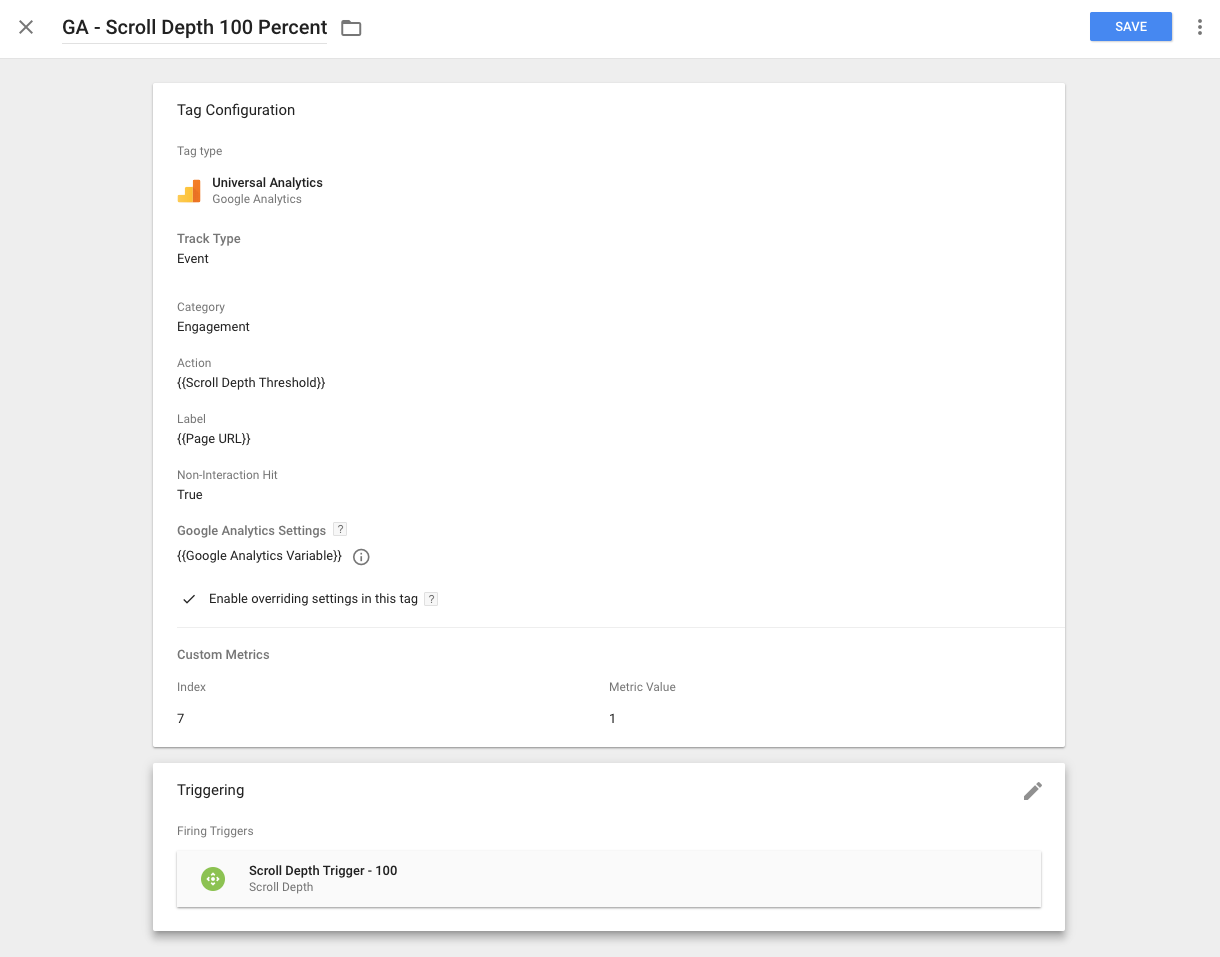
d) Create custom event tags pushing hits to Google Analytics:
Now we want to push an event hit to Google Analytics anytime a user reaches the end of the page.
This is done with a Universal Analytics Event track type tag within GTM.
In this tag, I’ve chosen to set:
- Event Category: Engagement
- Event Action: ad view – {{ Scroll Depth Threshold }} which is a native GTM variable for scroll depth
- Event Label: {{ Page URL }} which is the page where the user scrolled to completion
- Non-Interaction Hit: True which means these events won’t effect bounce rate
- Google Analytics Settings: Same process as previous steps here – enable overriding the setting in this tag as shown below, set the metric index, and set the metric value to “1”. This means anytime the user reaches the bottom of the page it increments by 1.
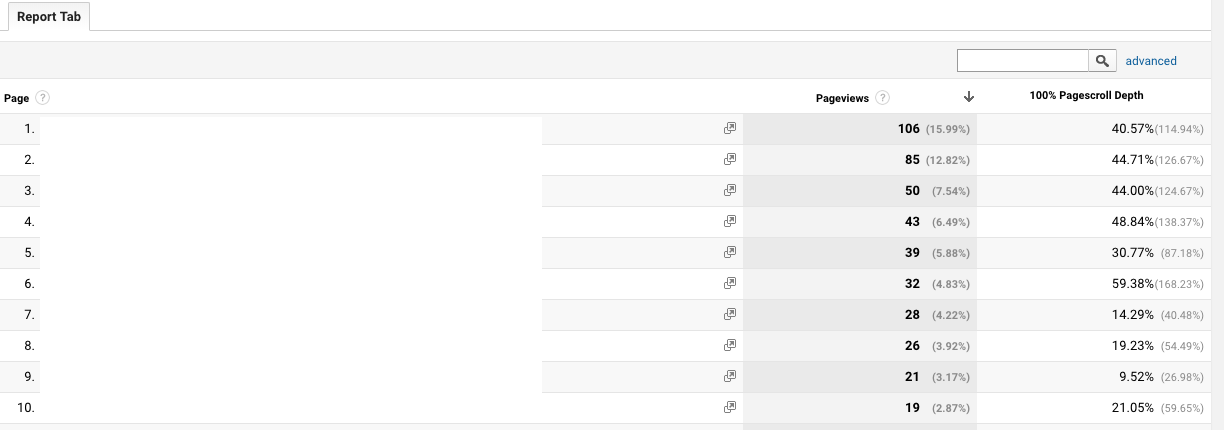
e) Example report
Here are two reports I’ve created with these new metrics:
This one showing by page URL:
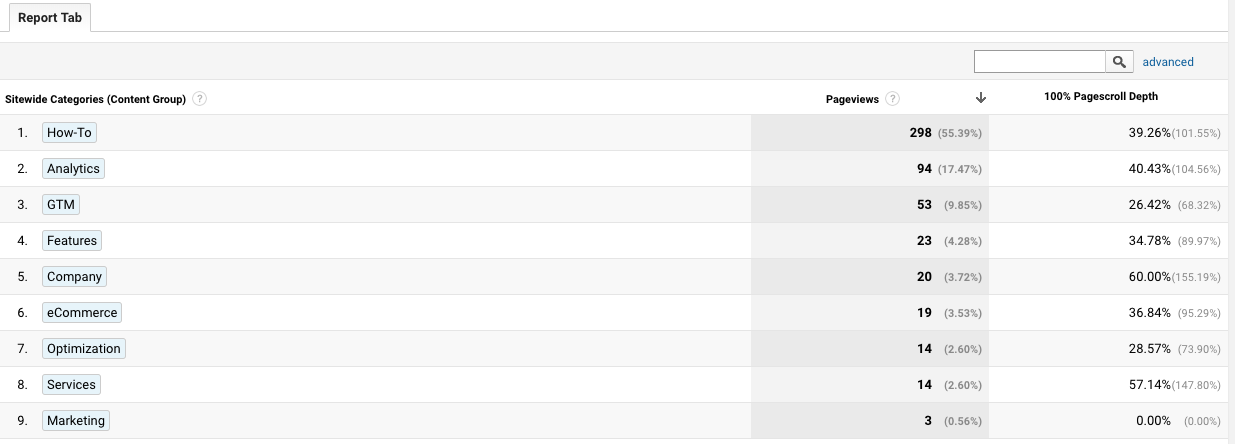
This is showing the same metric data by content grouping dimension:
Custom Dimension Creation
Now I’ll show how to create custom dimensions that you can use to append to our other hit level metric data created above.
This example will show how to create a category custom dimension. Think blog categories or even product categories.
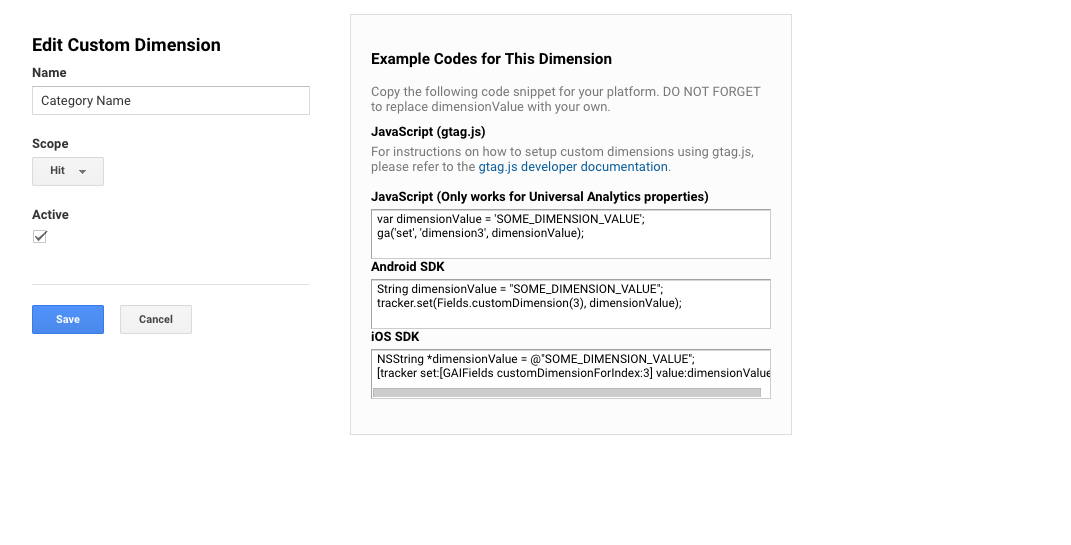
a) Create custom dimension in Google Analytics
Go to Google Analytics > Property > Custom Definitions > Custom Dimension > Create New Dimension
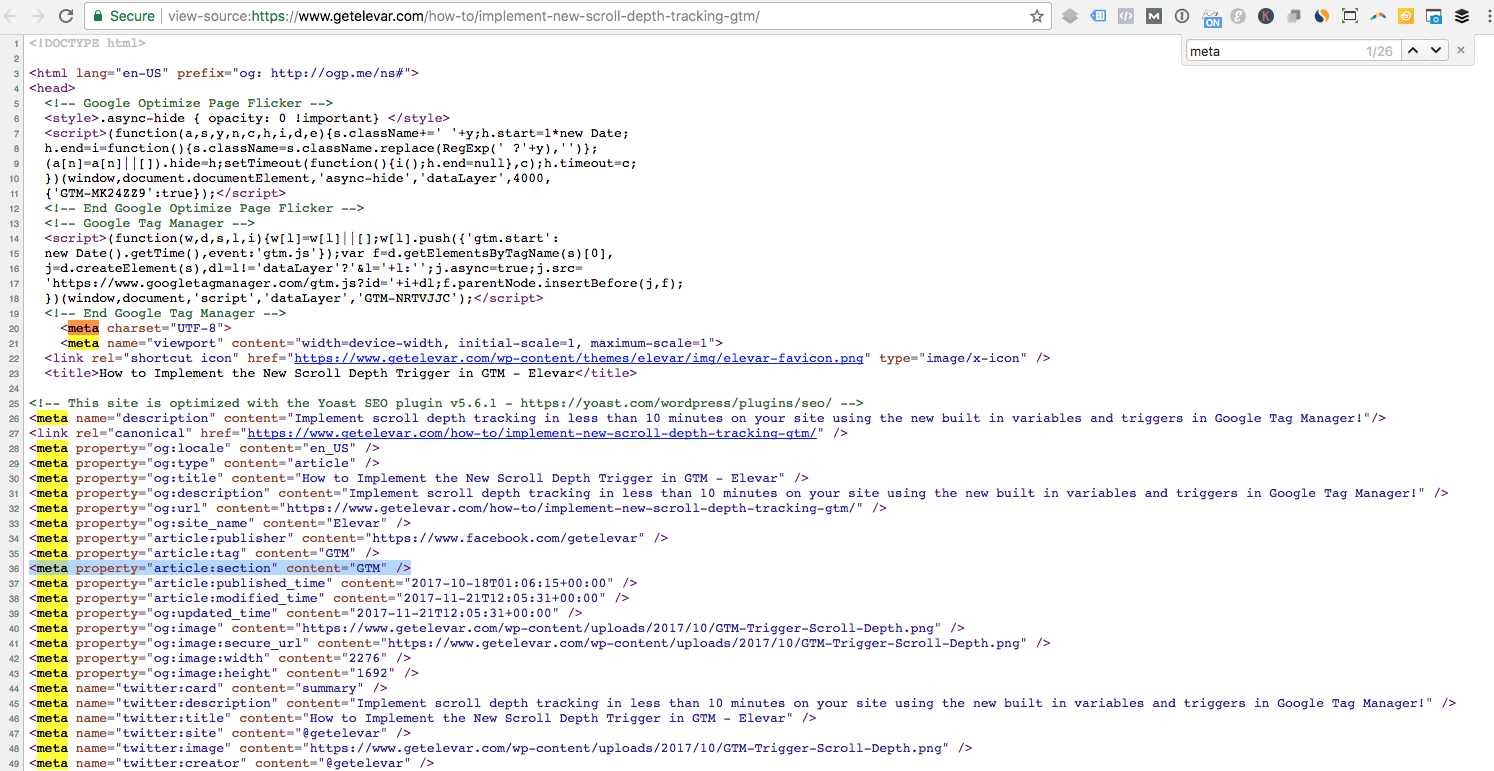
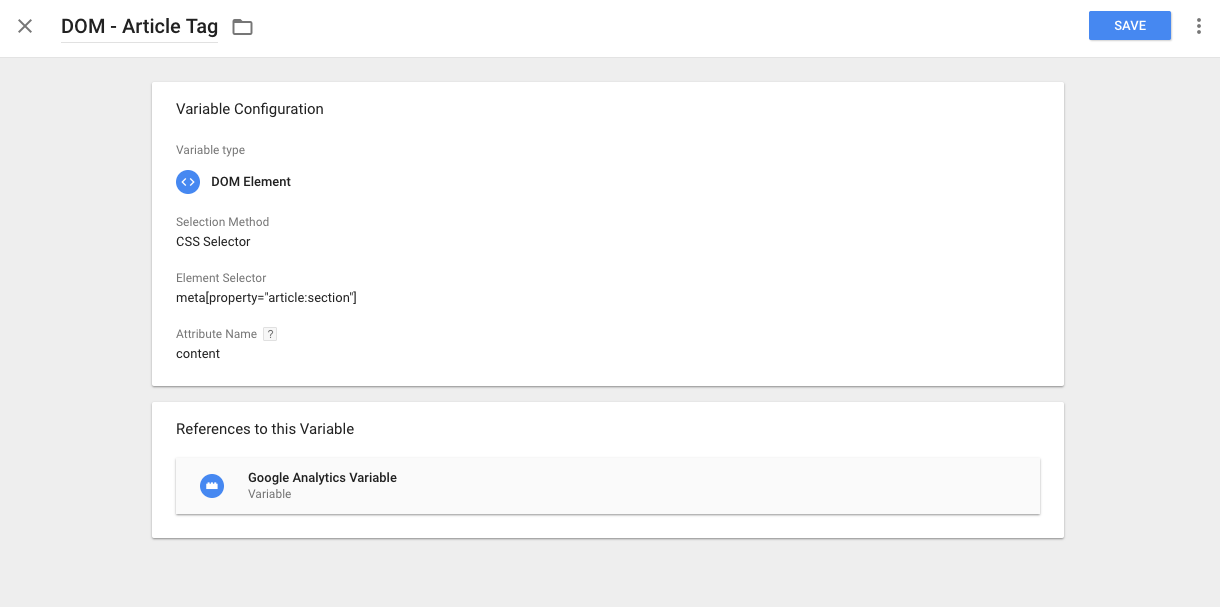
b) Create variable in GTM capturing category name data
In most cases this should be pretty easy for you to grab as (hopefully) you have a meta tag with your category data already in place like this (if you view your page source code by right clicking on your screen):
Which you then set in your new GTM variable like this:
Google Tag Manager > Variables > Create New Variable > DOM Element Variable:
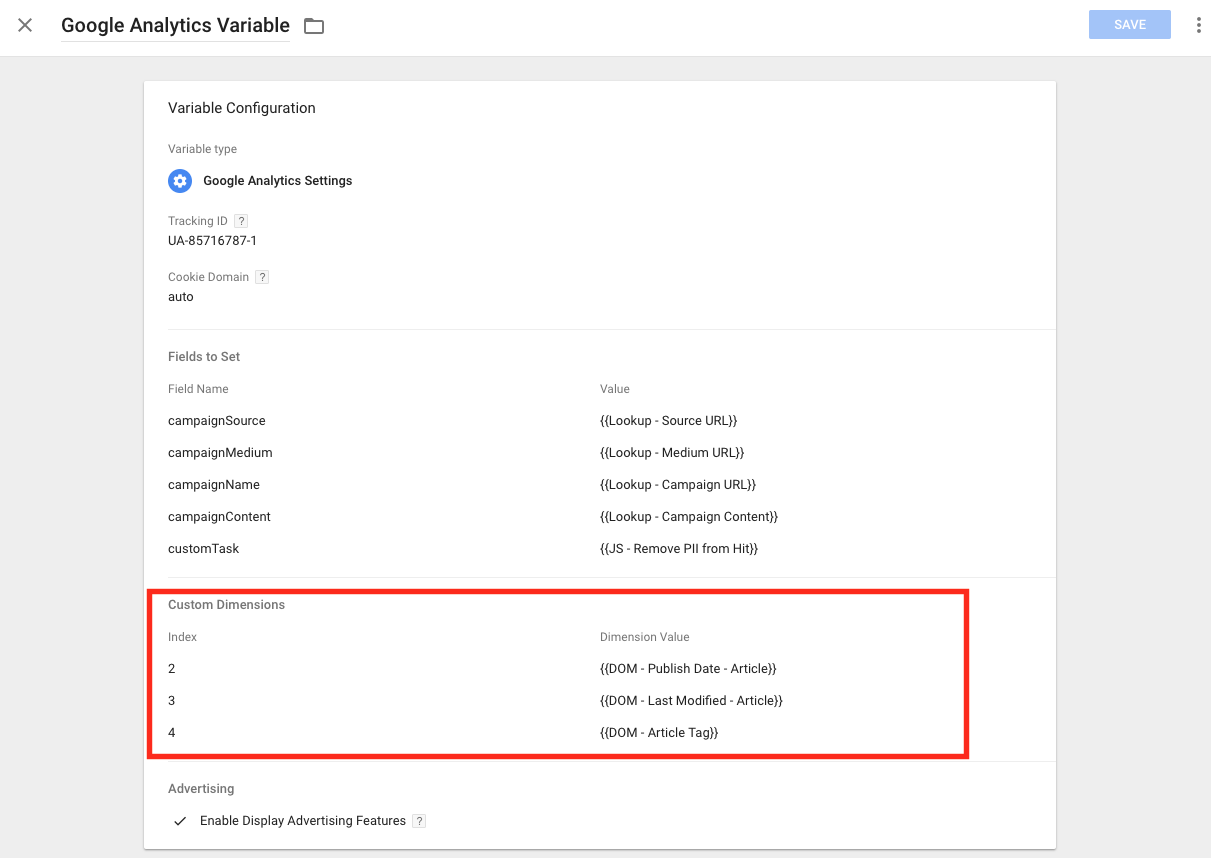
c) Set the custom dimension in Google Analytics variable
If you’re using the native Google Analytics variable, then set this dimension as shown below which has to be the Google Analytics variable associated to your All Pageviews sitewide pageview tag.
 That’s it!
Repeat this step for publish date, authors, or any other metadata you’d like to pivot all of your new metric data from.
Content Grouping Setup
In some ways, creating content groups accomplishes the same things that you can do with custom dimensions (as shown above).
This guide won’t go into in depth detail on all of the ways to manage content groupings, however I’ll show a few different examples of how to set these up.
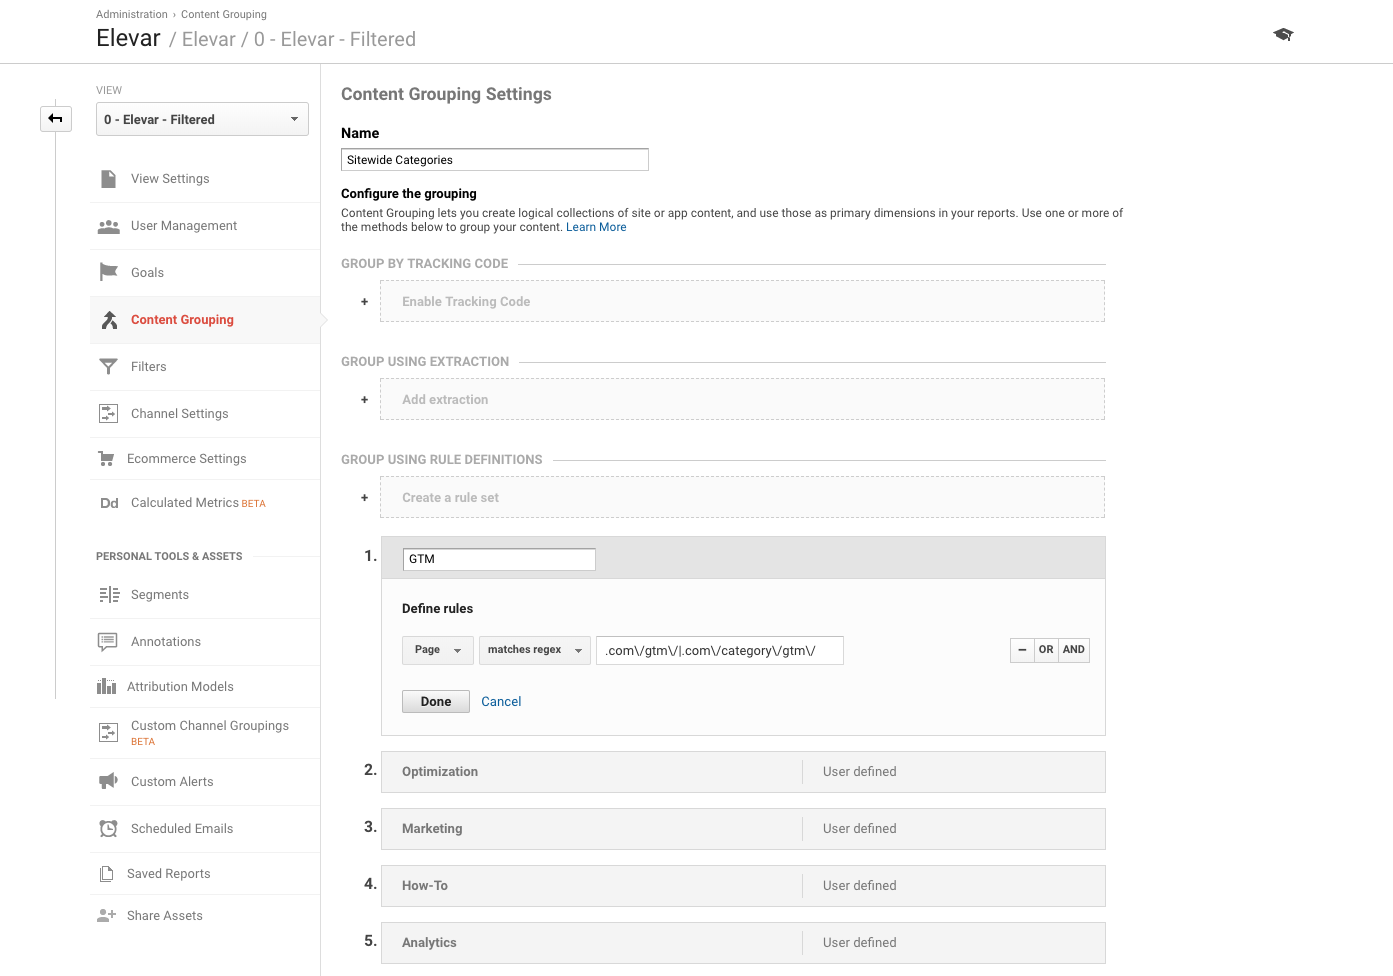
a) Group Using Rule Definitions
For category management, this is how I have our content grouping setup for this blog. I’m using a page URL match via regex for each category landing page and article assigned to primary category:
b) Group via Code
If using GTM, this is just as easy as setting a custom dimension within your event tag.
- Create your content grouping in Google Analytics (e.g. “Category”)
- Save your content grouping index number
- Set your content grouping index number and category name variable on your Google Analytics variable as shown here:
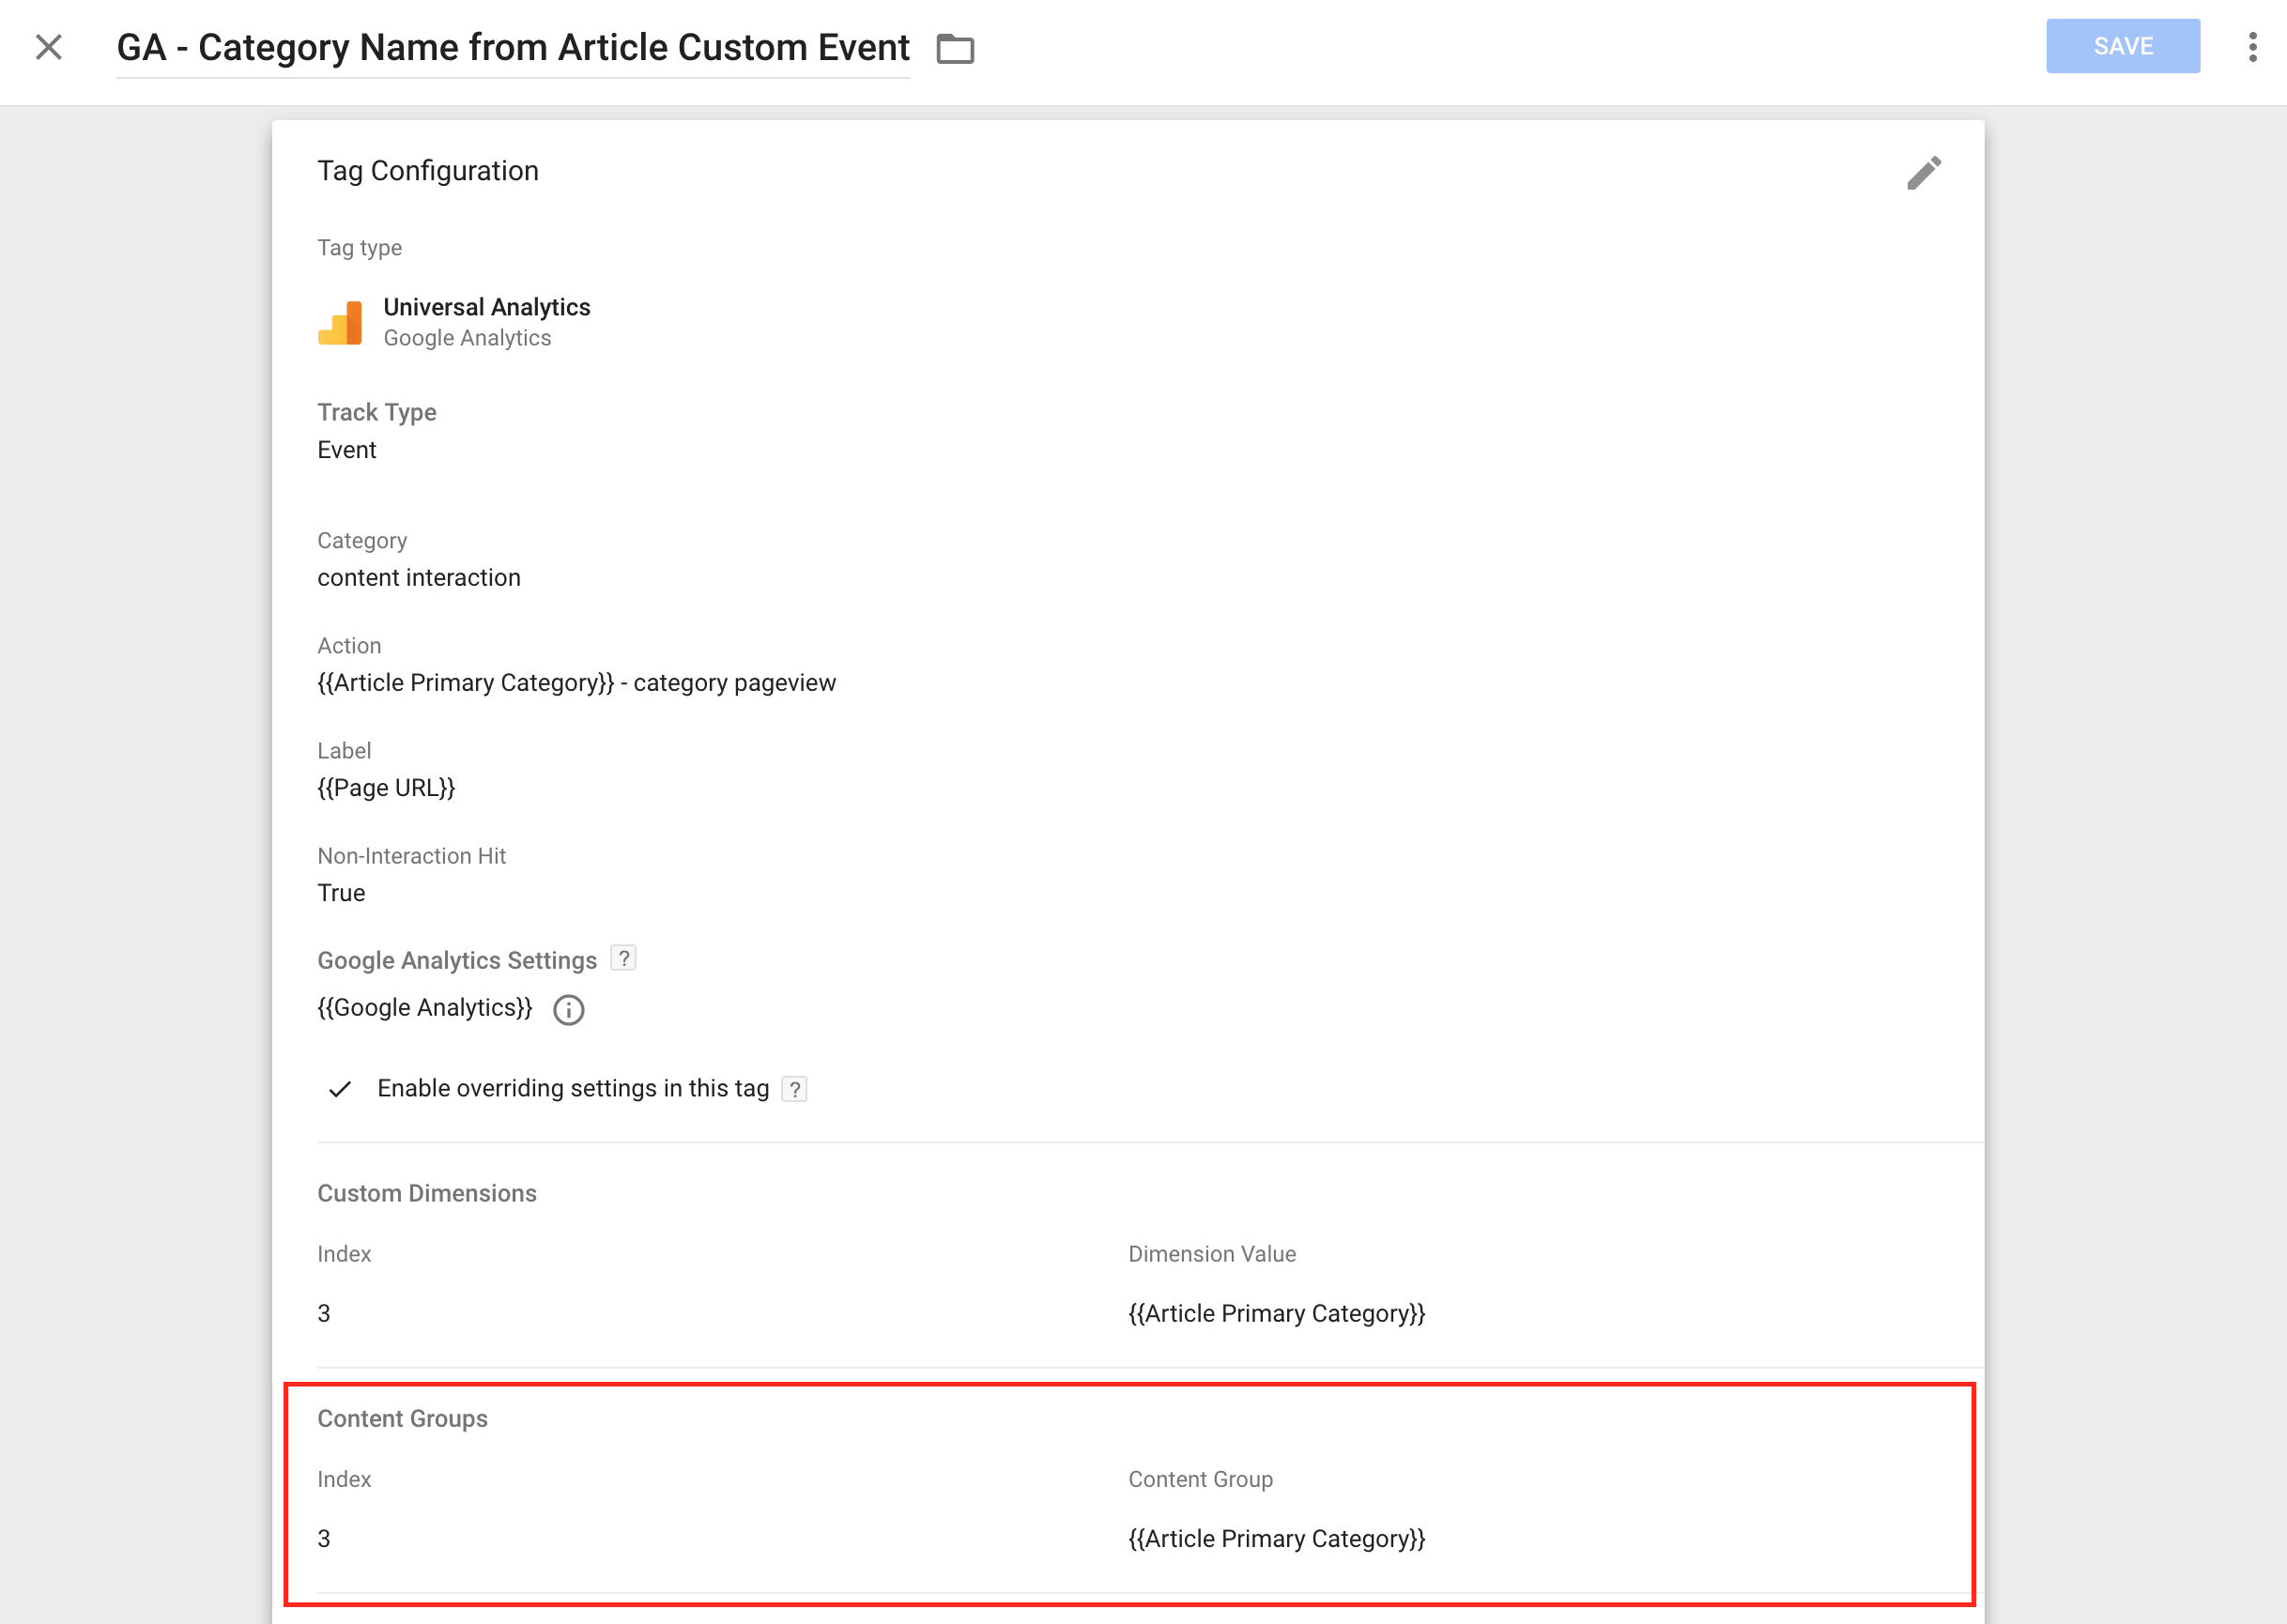
That’s it. You’ll then have reports that look like this:
Let’s Pull it All Together
In addition to all of the example reports I showed above, now that we have all of our custom metric and dimensions in place we can pull these into their own reports by page, device, campaigns, source, etc.
Here’s a custom Google Analytics report by Author:
Here’s a custom Google Analytics report by Parent Category:
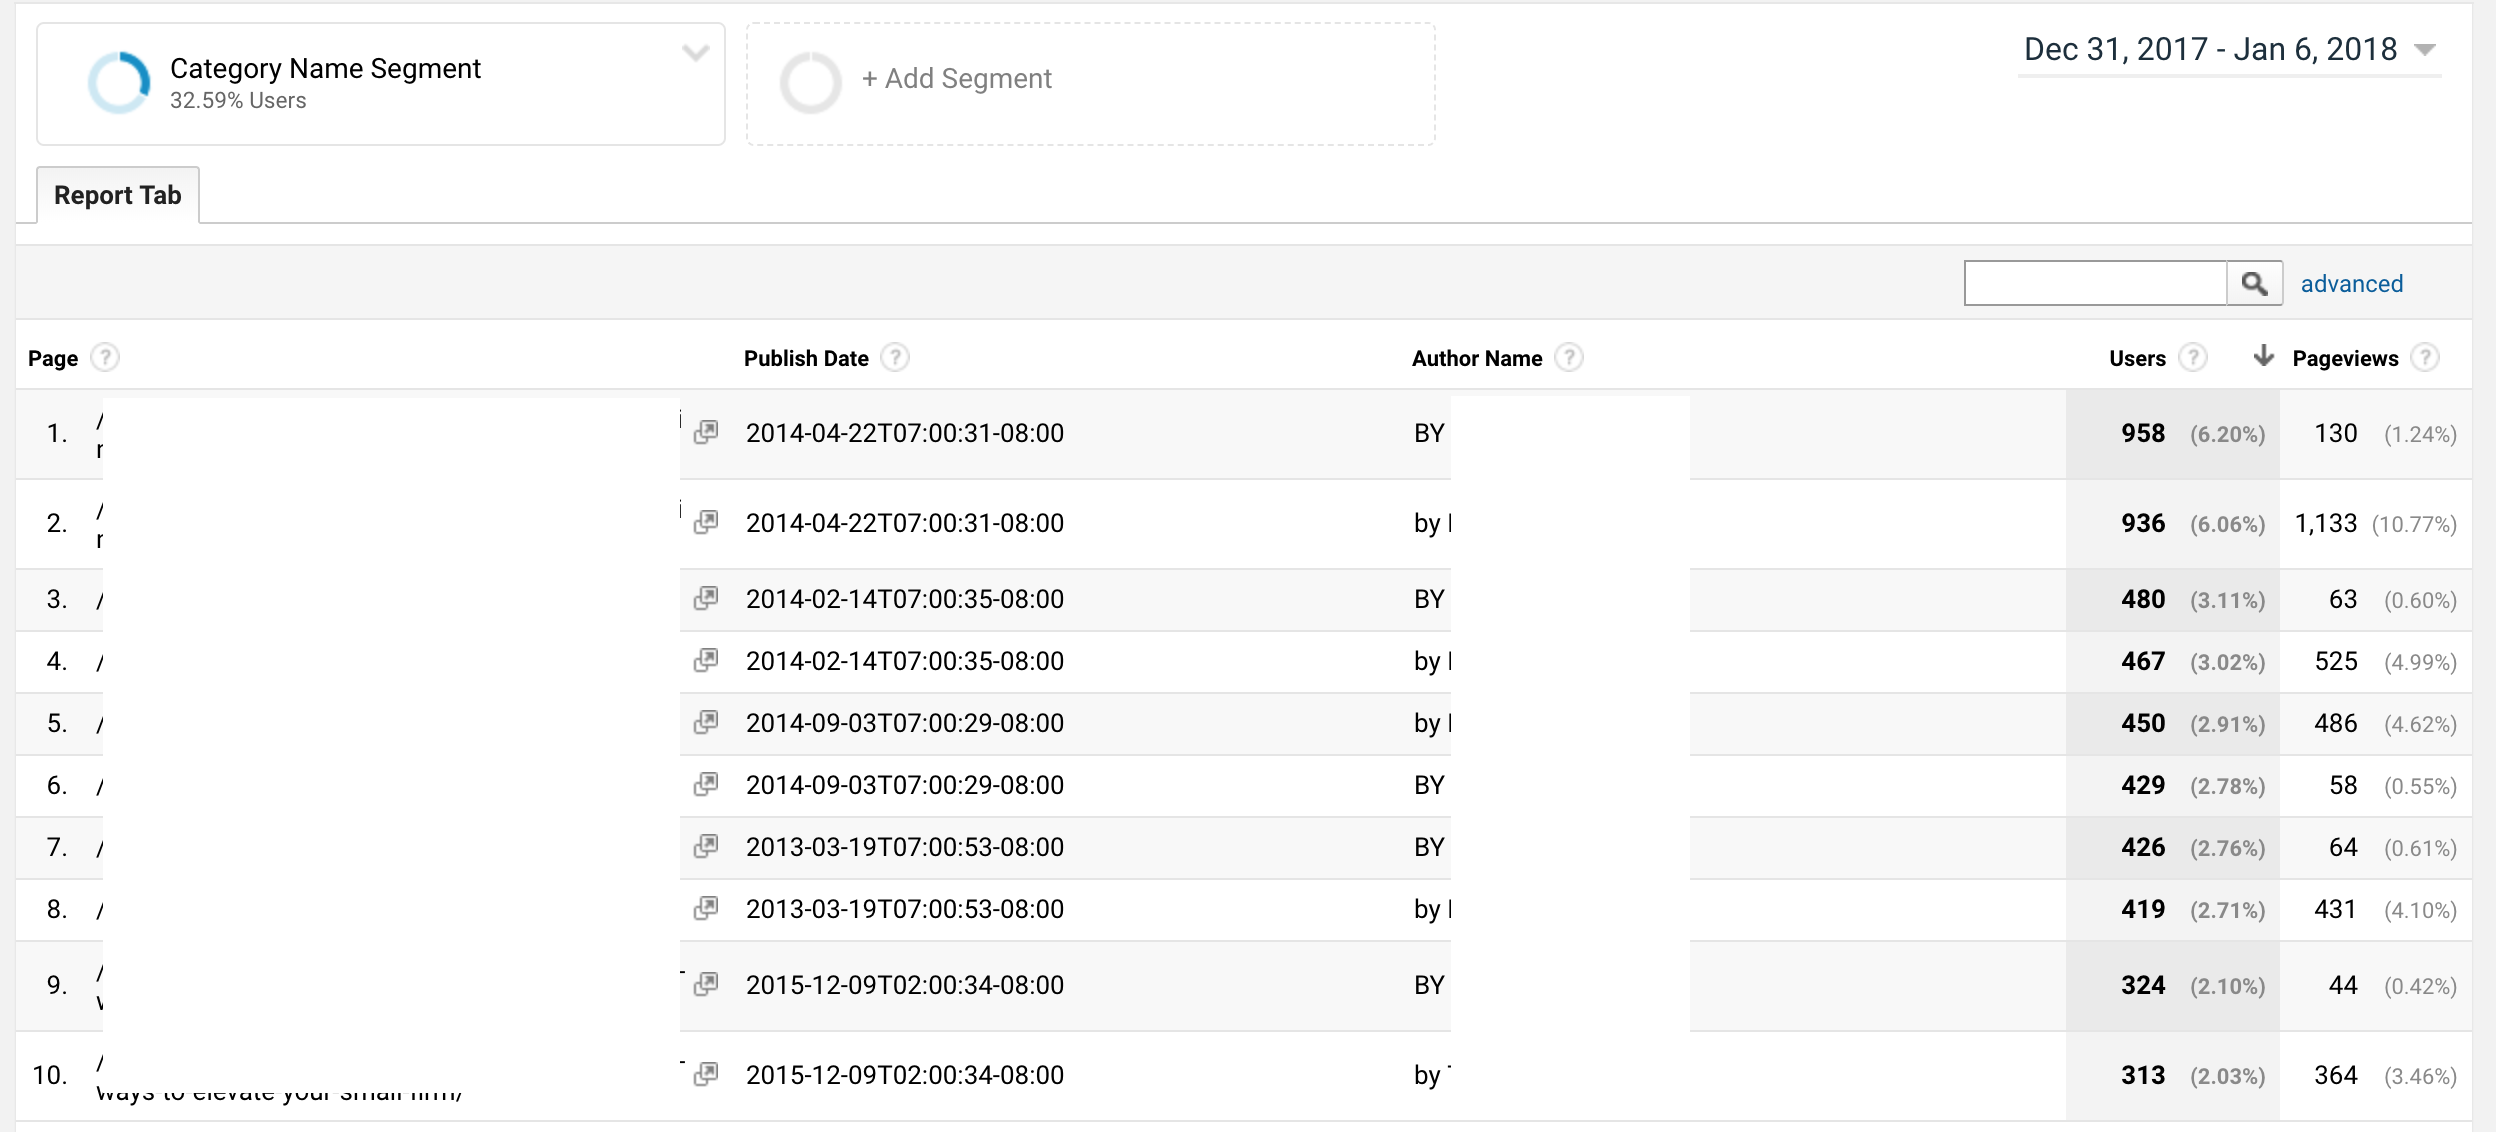
Here’s a custom Google Analytics report by post within a Category:
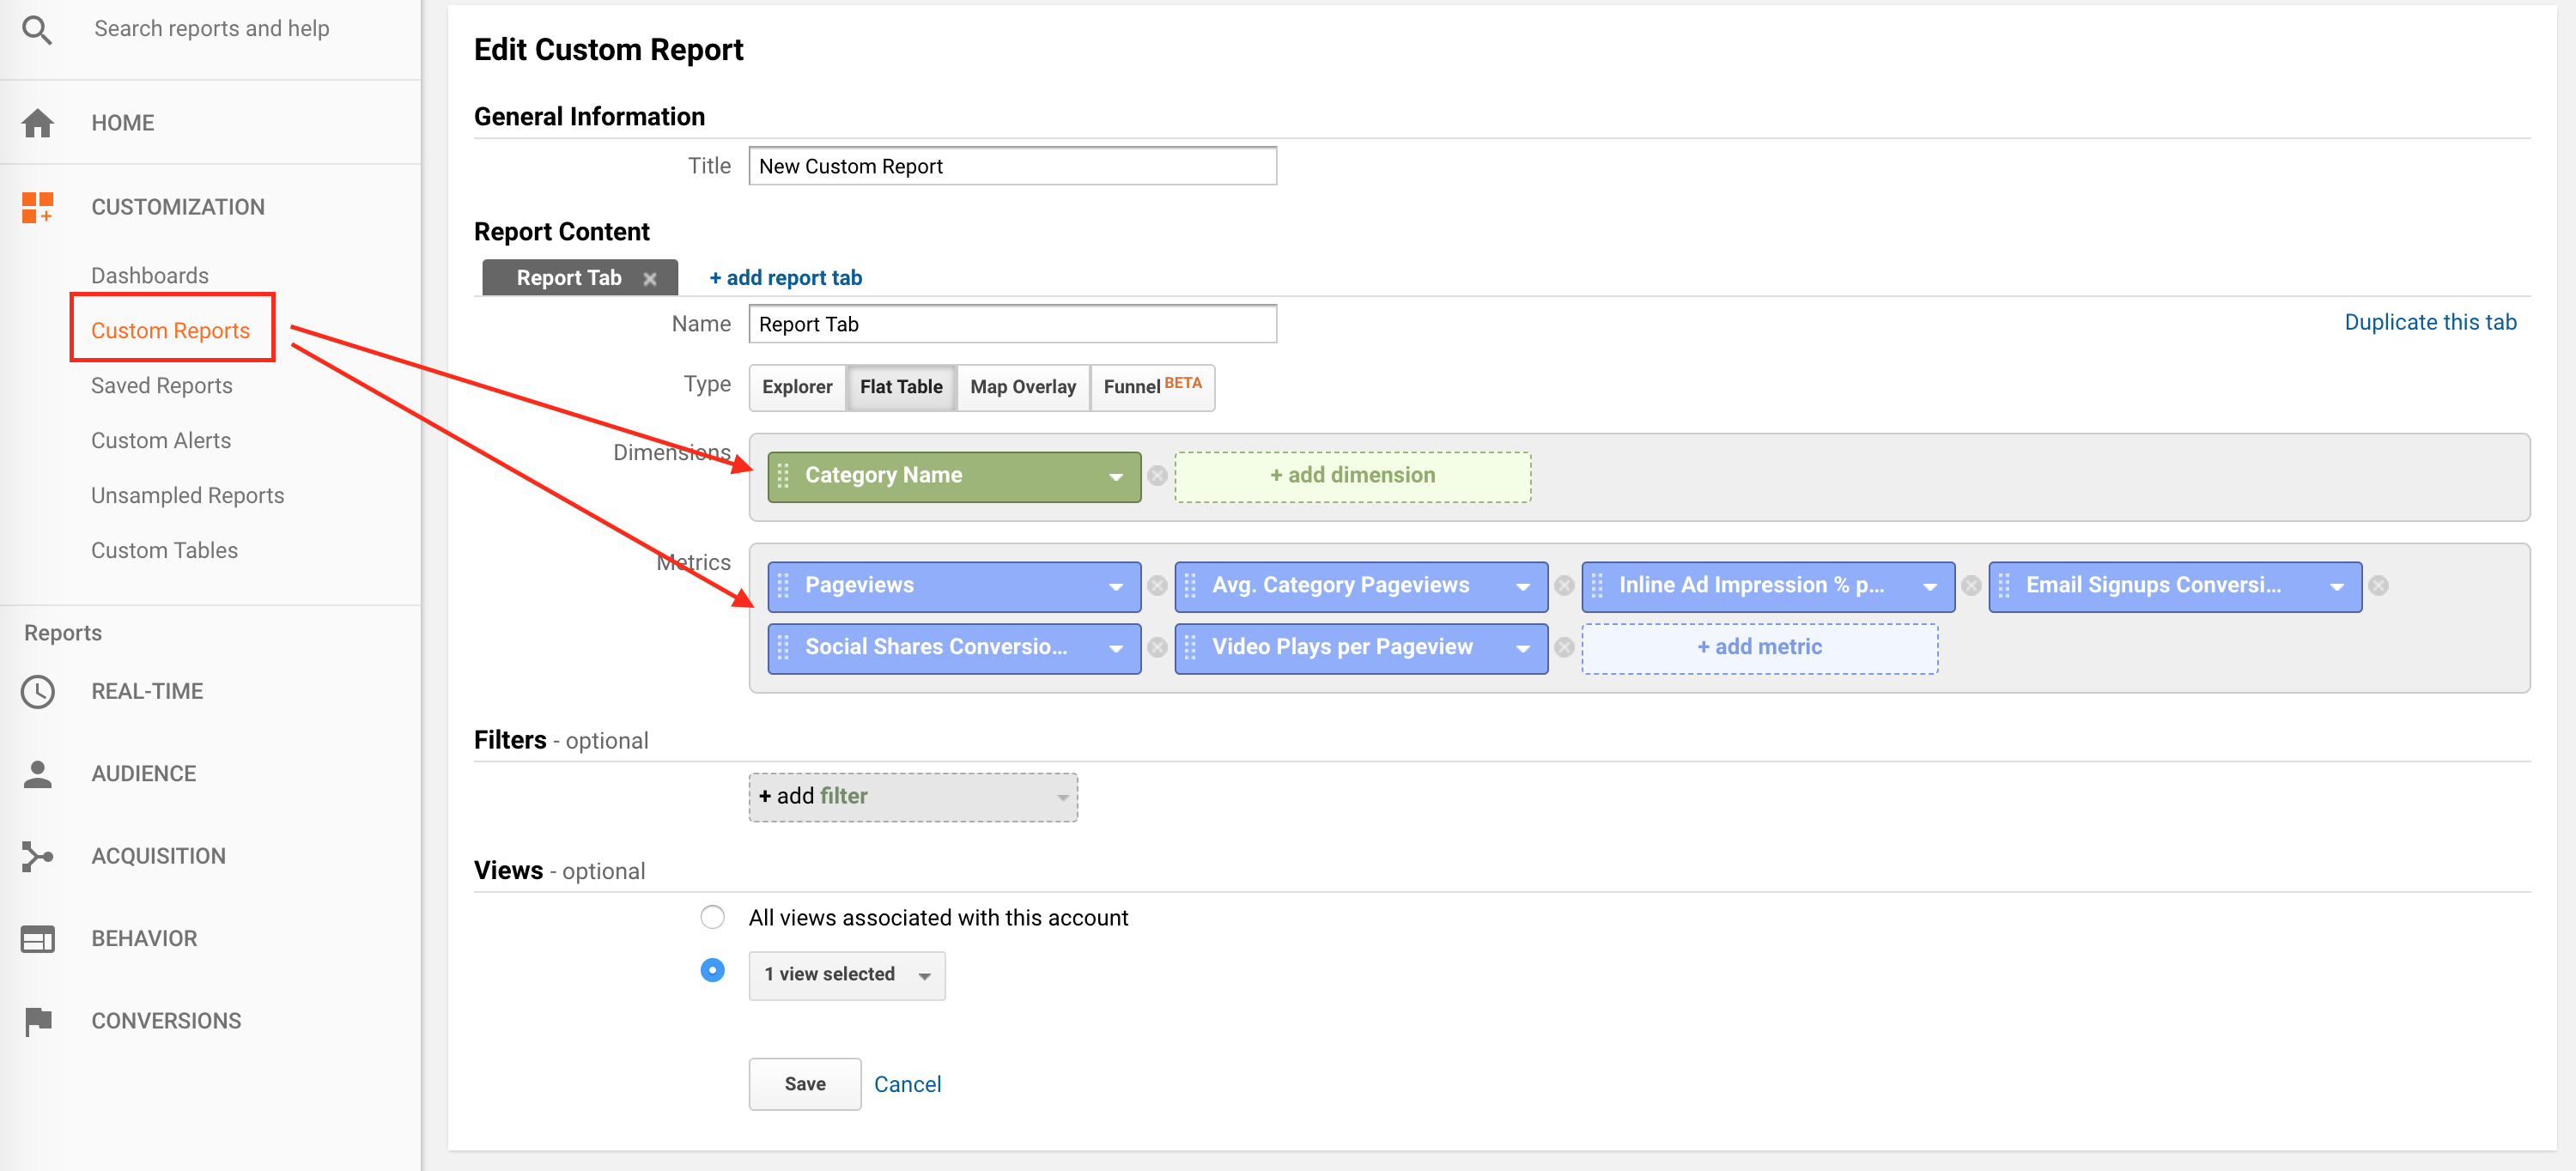
These are all created under the custom reports section within Google Analytics. Just select your dimension and metric combinations:
Or you can append these dimensions to existing reports like this new vs returning users:
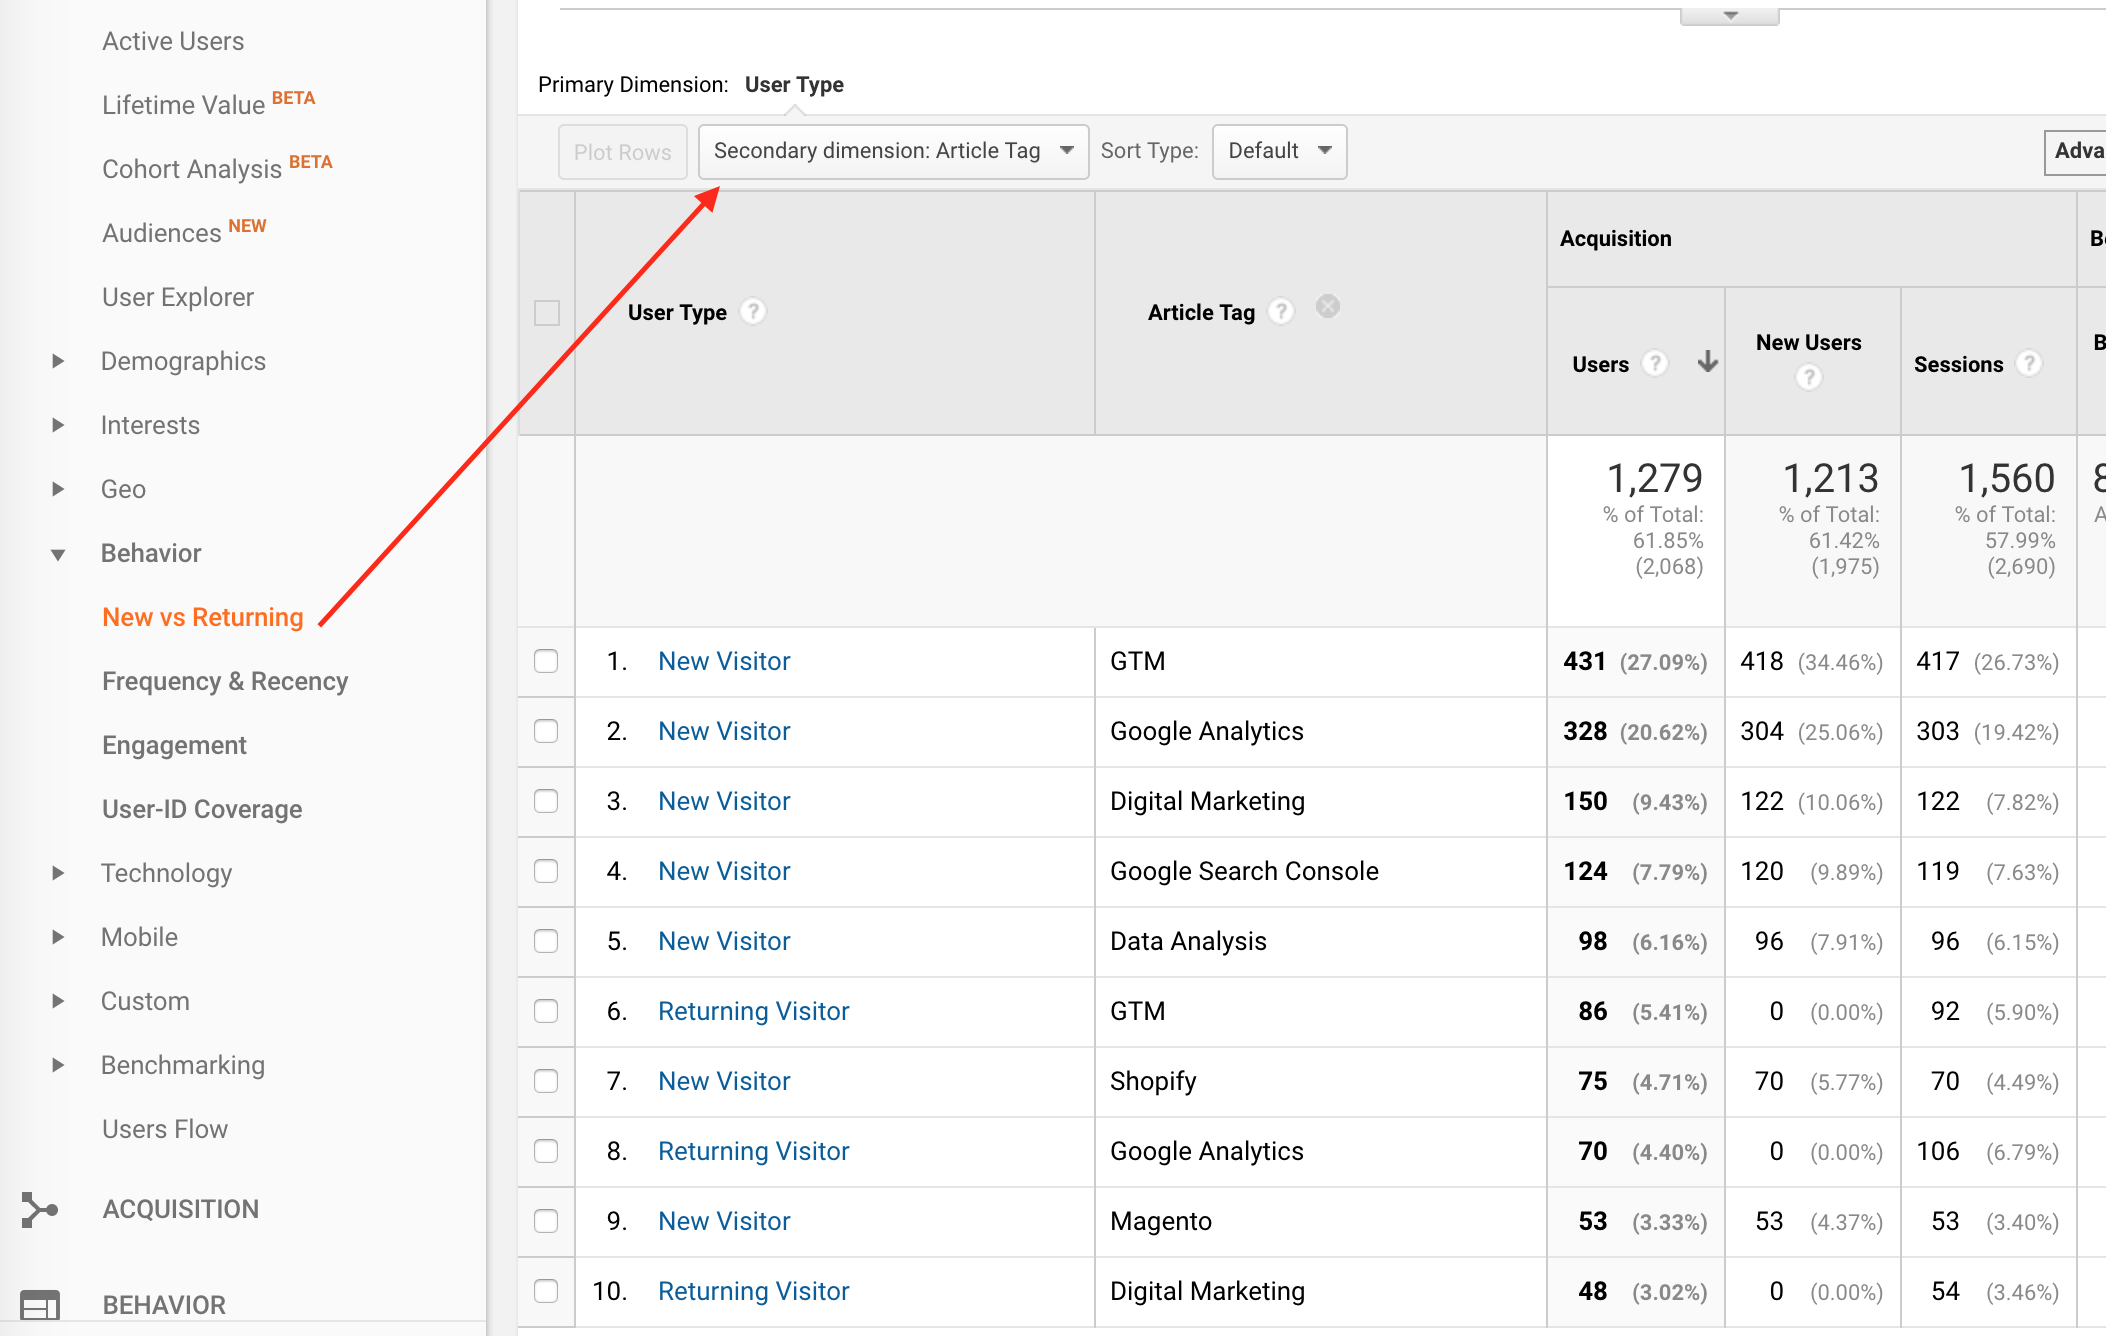
As you can see with a little bit of work taking advantage of Google Analytics and Google Tag Manager then you can create your own amazing content analytics reports and dashboards.
Want help implementing or customizing for your own business? Contact us and we’ll take care of it for you!


Leave a Reply