eCommerce Conversion Funnel Customization: How-To Guide
See how to build a complete conversion funnel using GTM & GA to accelerate your onsite optimization.
Brad Redding
Brad Redding is the Founder & CEO of Elevar. Specializing in analytics, tracking, GTM, and conversion optimization.
Look no further than your onsite conversion funnel when searching for ways to increase revenue.
Conversion funnels that you might be familiar with are:
- Google Analytics Enhanced eCommerce – shopping and checkout behavior funnels
- Native Shopify conversion step reports
- Google Analytics goal funnels
But these are missing key steps like:
- What % of sessions from your homepage make it to collection or product pages?
- What % of sessions that view collection pages proceed to view products (either via quick view or clicking to view the product details page)?
- What % of sessions that reach checkout are exiting to pay via Amazon or Paypal but never return?
In this guide (specific to Shopify but applicable to other eCommerce platforms) I will show you:
- Common Conversion Funnel Reports
- Micro-Funnels
- How to Create Your Own Custom Funnel via GTM
- How to Visualize Your Conversion Funnel via GA and Elevar
You’ll be equipped with a process to build your own complete funnel taking the uniqueness of your store into play.
The result will allow you to visualize opportunities on your website to help you make informed optimization decisions and maximizing your marketing spend!
Let’s look at the existing conversion funnel reports that you already have access to.
Common Conversion Funnel Reports
Google Analytics
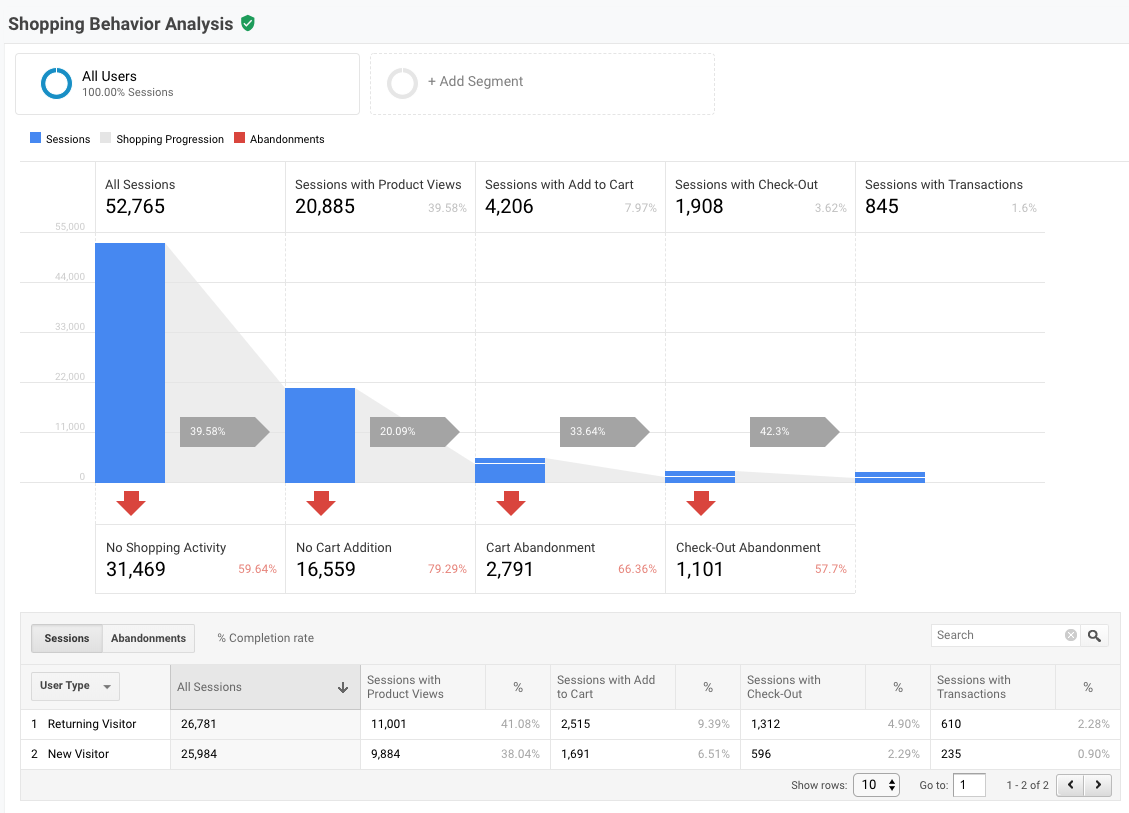
Assuming you have Enhanced eCommerce enabled, inside of Google Analytics > Conversions> eCommerce > Shopping Behavior you can see key steps like % of sessions w/product views, add to carts, etc.
This report also shows you how each step performs in micro-funnels. If you look at sessions with product views you’ll see the 20.09% arrow pointing to sessions with add to cart. This means 20.09% of sessions who viewed product pages continued to add to cart.
You can also use the row report below the graph to look at this by various dimensions. This is a very powerful report (and one of my favorites in GA!).
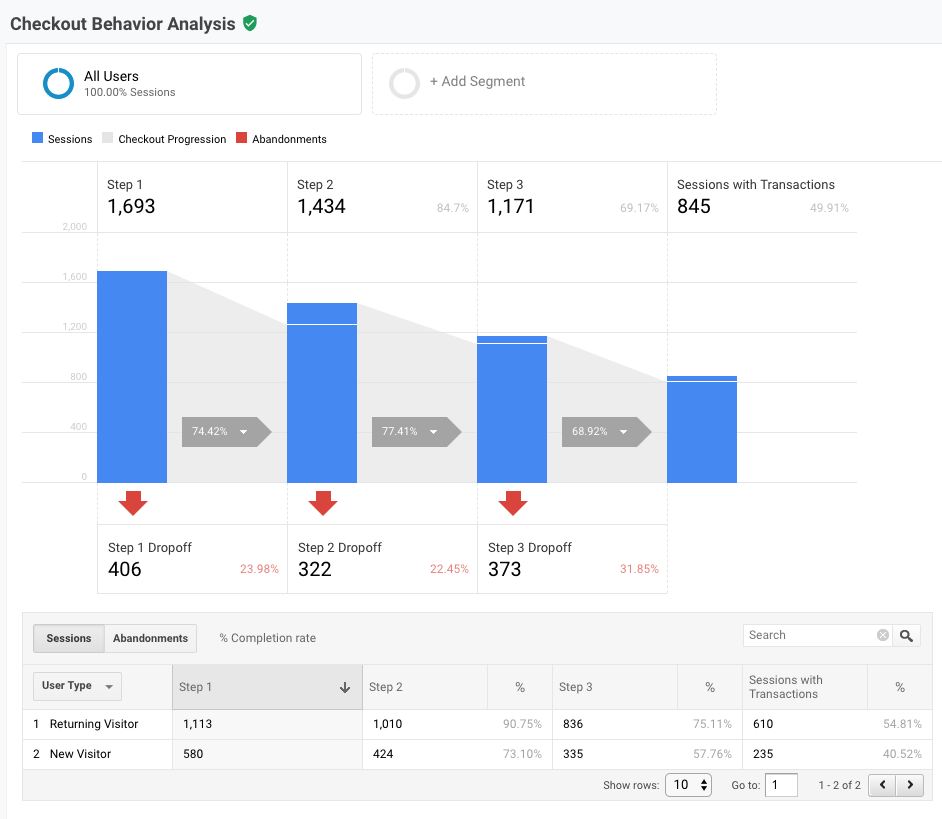
And if you’re using our leading GTM App for Shopify then you can also visualize the Checkout Behavior report for your checkout funnel which is not possible out of the box with the Shopify/Google Analytics integration:
These are great but we are missing out on key merchandising/higher up in funnel data like collection or home pages (let alone search, blog, about etc pages).
You might be asking – what about the Merchandising List report in Enhanced eCommerce?
This is another under-utilized report (it is empty in the native Shopify GA integration – our GTM app helps with this as well). But you still don’t get a true visual of % of sessions that view collection pages that move on to view product details.
We get product list CTRs but I don’t like the way these are calculated. On every collection pageview you’re sending a “product list view” for every product that loads. So if your pagination is 24 products then you send 24 product list view hits but if pagination is changed to 60 then you send 60 of these same hits on a single pageview. You can only click on one product at a time!
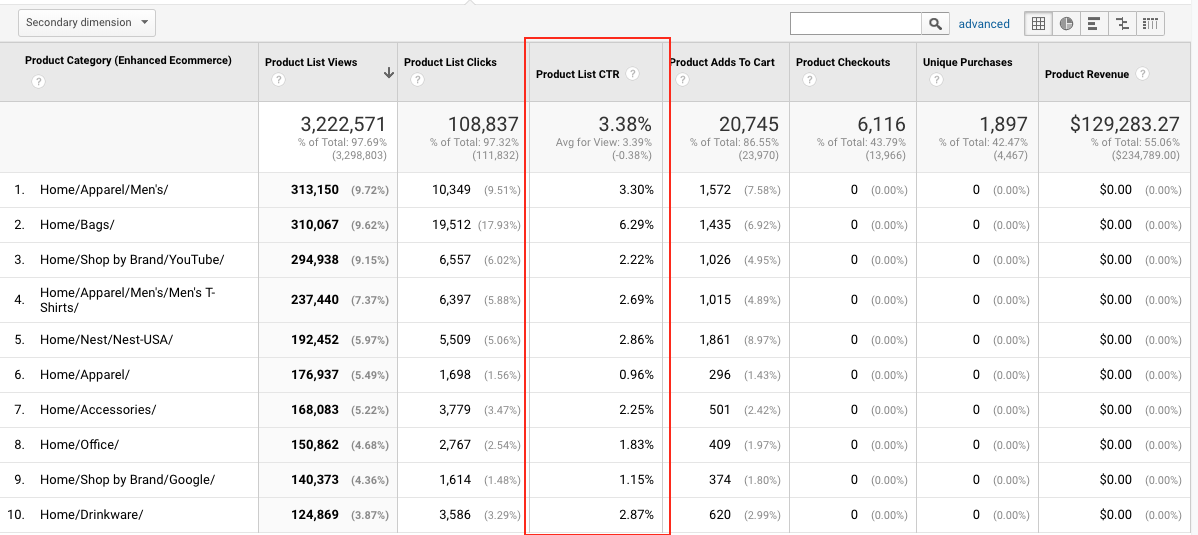
So for the 24 product pagination you have a CTR of 4.16% (1 click divided by 24 views). And the 60 paginated category is 1.66% (1 click / 60 views).
See the issue (oh and the screenshot is from Google’s Merchandise Store GA – see how they don’t even have the full eComm data passing through from category to purchase?!)?
This is when Google Analytics Goals w/Funnel Visualization is utilized where you can set up a full funnel starting with your homepage. Depending on your site structure you might end up with a fairly large funnel UI like this (you’ll see I couldn’t even squeeze checkout into the screenshot!):
But if you’re like me you’ll want to see more details:
- How do these steps perform by channel or campaign?
- How is this trending over time?
- What micro-funnel step had the biggest change in the last 30 days?
This is usually where I resort to pulling together something manually in a spreadsheet (or gosh – try and use the behavior flow report in GA AHHH!)
Shopify Reports
We have hundreds of Shopify store owners using our analytics product or GTM App and many still rely on the native Shopify analytics reports for quick at-a-glance visuals.
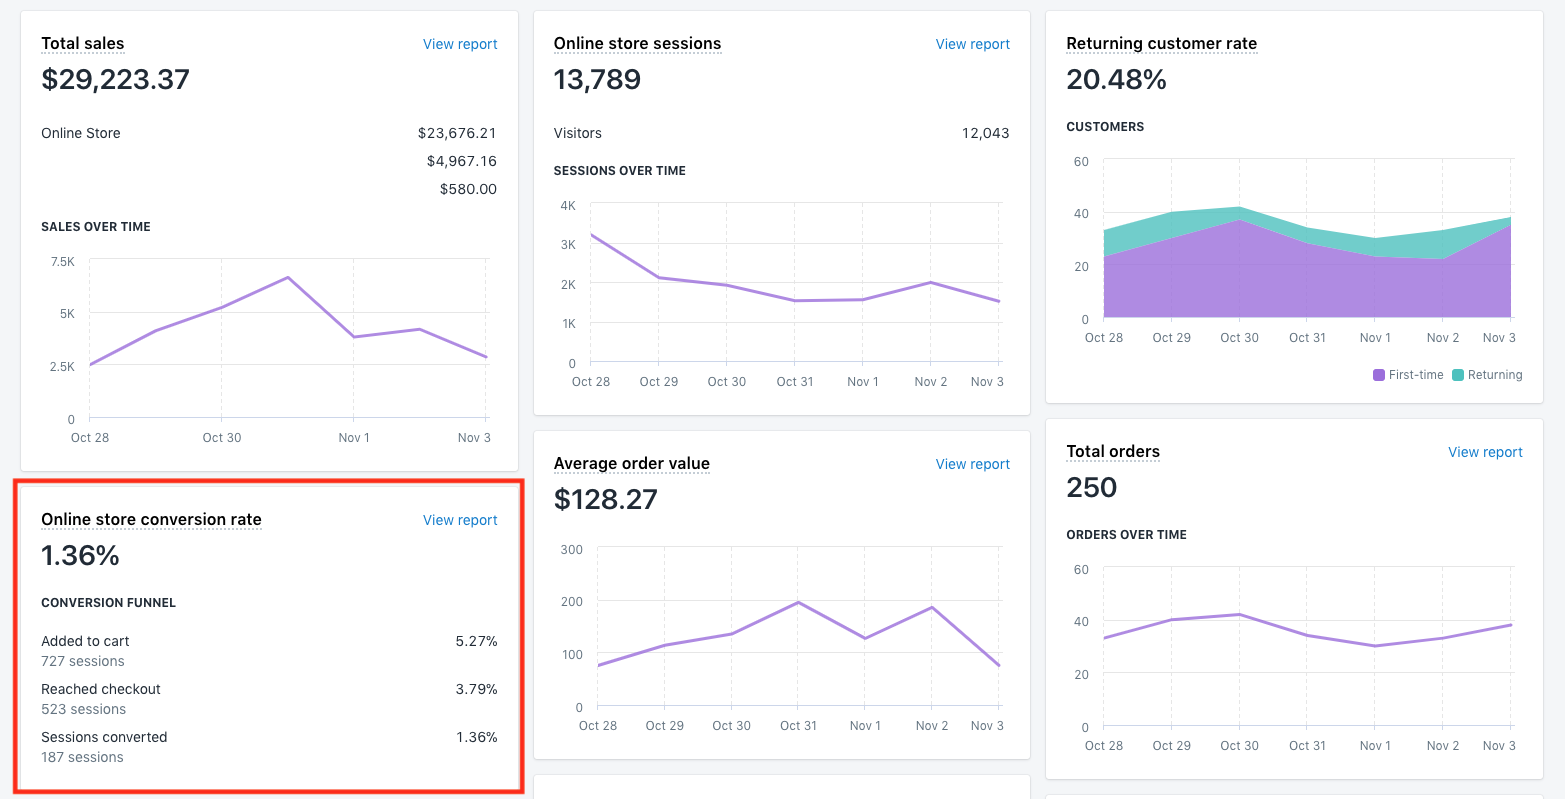
Like this main dashboard snapshot funnel:
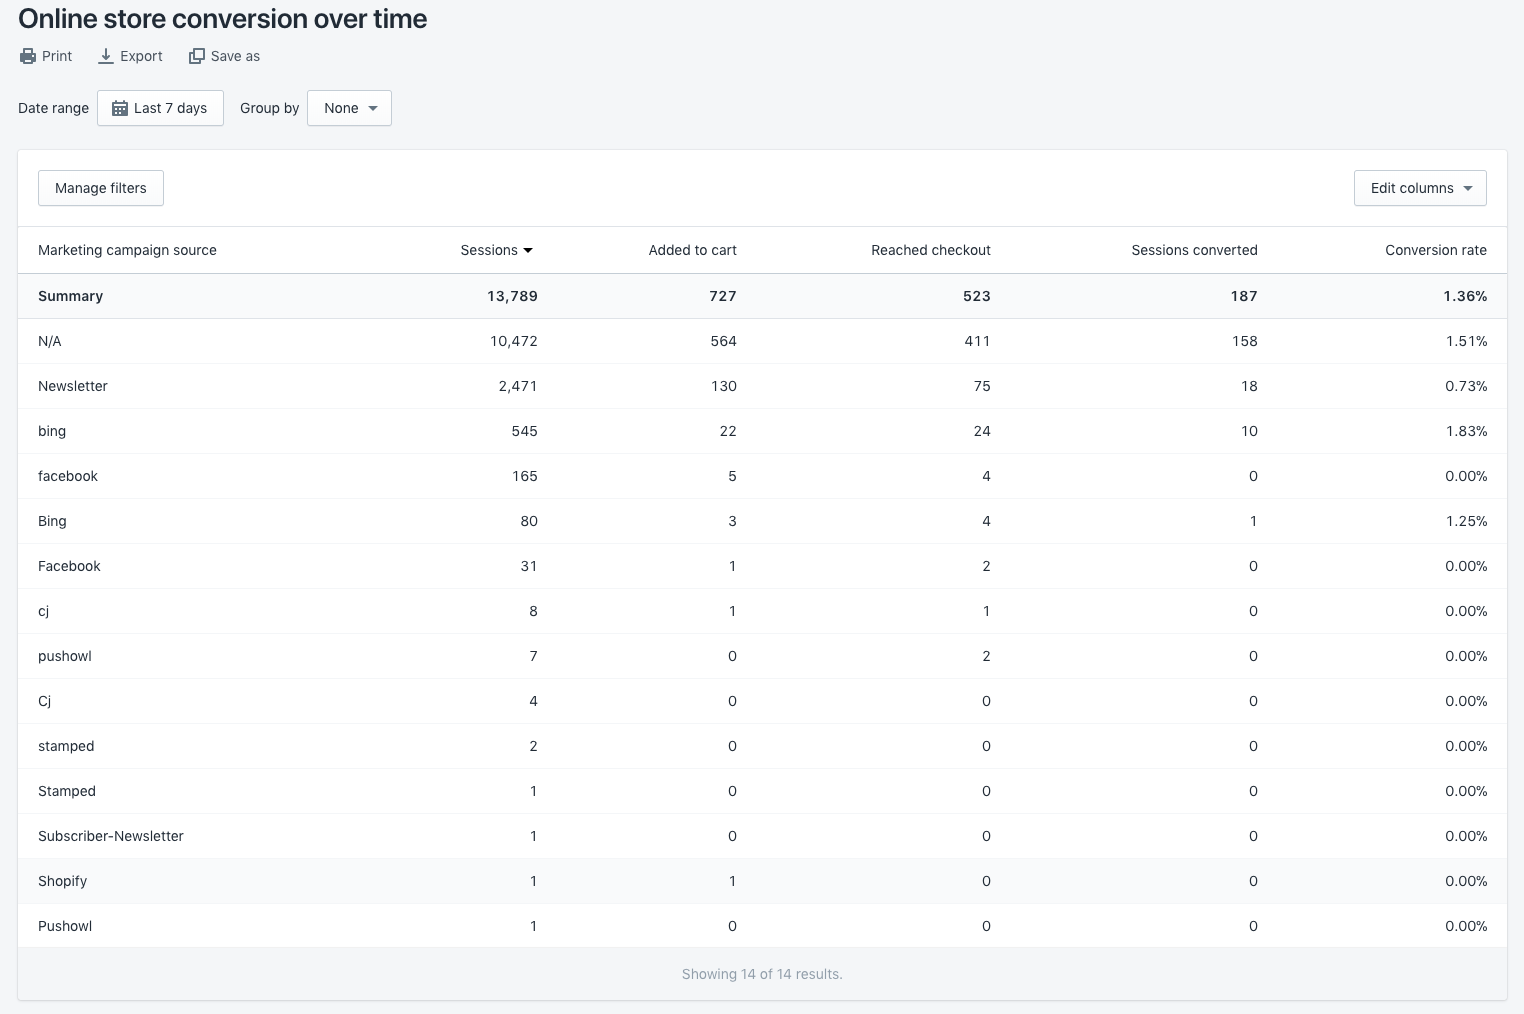
Which you can dig into further to review by channel, campaign etc (viewing add to cart, reached checkout, etc):
These reports are helpful but you’re still missing out on the same key areas lacking in the Google Analytics reports.
- Collection page performance
- Landing page => product view/add to cart performance by channel
- Micro-funnels in checkout for alt payment methods
So how can you fix this?
Google Analytics + Google Tag Manager + Elevar of course!
Micro-Funnels
I like to think of micro-funnels as single steps as part of a larger funnel. Funnels are not linear nor the same for every store – there are unique paths your customers take as well as features that you may introduce over time that modifies the typical funnel the reports above enable.
Consider these KPIs:
- Home Pageview => Collection or Product Pageview (how powerful is your homepage marketing messaging)
- Collection Pageview => Product Pageview (how does your merchandising perform?)
- Product Pageview => Add to Cart (how convincing/valuable is your product presentation?)
- Add to Cart => Initiate Checkout (how much friction does your transition to checkout contain?)
- Cart/MiniCart => Checkout (how much friction/distraction does your cart page provide in the proceed to checkout option)
- Checkout => Thank You (how seamless and frictionless is your checkout process? Do users have access to key questions in checkout?)
- Quick View => Add to Cart (is quick view helping or hurting add to cart ratios?)
- Quick View Add to Cart => Checkout (is process of quick view to checkout easy for users?)
- About Us => Add to Cart (how valuable is your brand story in building consumer confidence and trust?)
- Blog/Content View => Add to Cart (how valuable is your blog/inbound marketing content to transitioning browsers to buyers)?
Can you think of unique journeys on your site that users take to in their path to purchase? If so, take note of these as you’ll need them for the next step!
How to Create Your Conversion Funnels
Tools that you are going to need are:
- Google Tag Manager
- Google Analytics
- Our GTM Container w/Instructions
Step 1: Create Funnel Tags in GTM
You can create these tags from scratch or download our pre-built GTM container that contains all of these tags below:
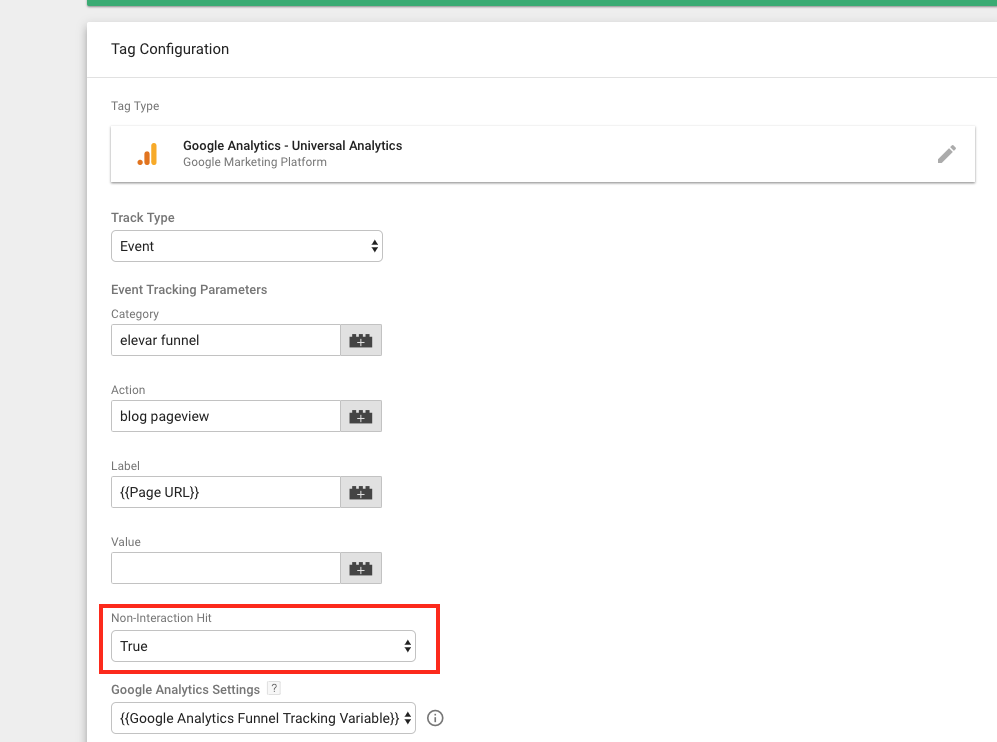
If you are creating these from scratch – PLEASE SET ALL TAGS TO NON-INTERACTION HIT TO TRUE.
If this is not set and it’s a pageview trigger then you will kill your bounce rate and other metrics:
Import GTM Container Steps
Once you’ve downloaded the GTM container then go to GTM > Admin > Import Container > and Import.
Please be sure to select MERGE as shown in image so you don’t overwrite any existing tag or trigger assignments:
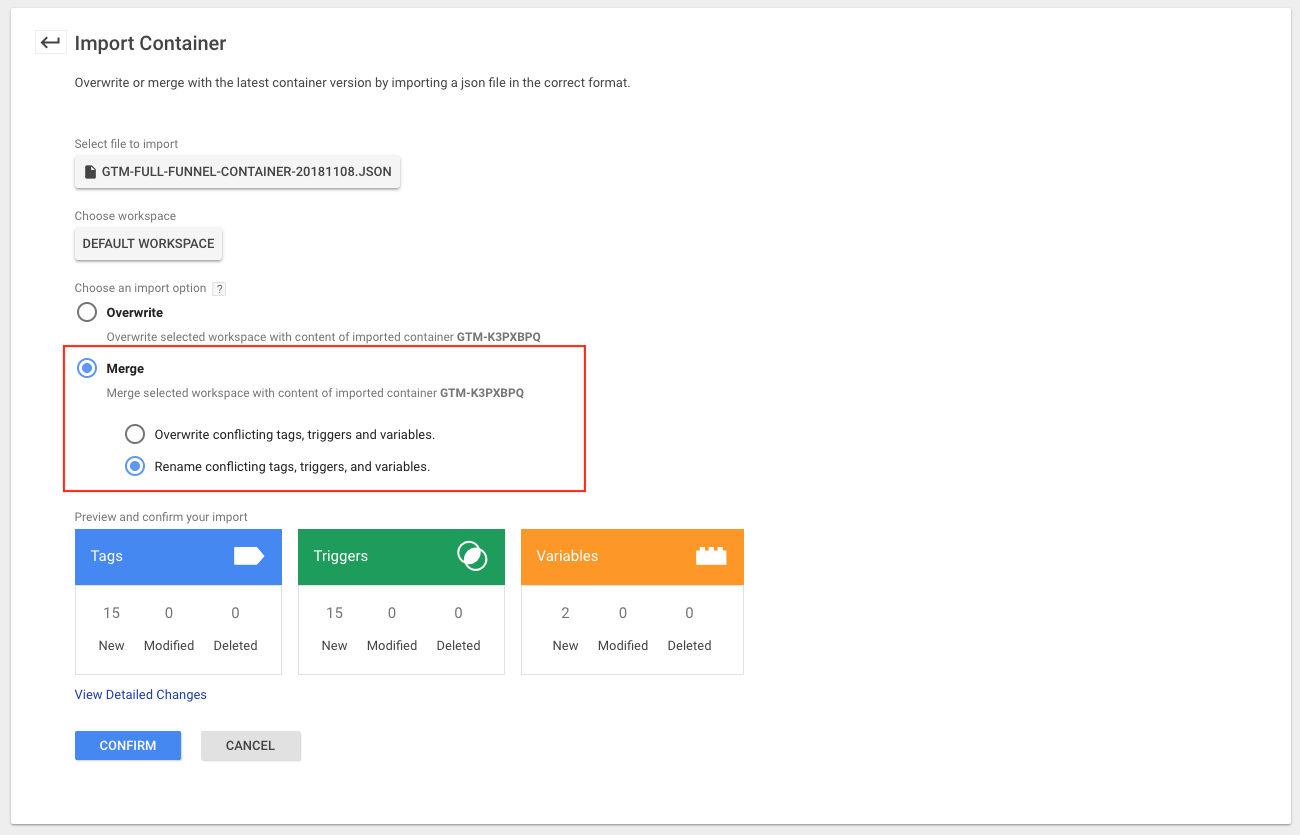
Once you click confirm you’re good to go to next step of updating your triggers as needed.
Step 2: Update Triggers in GTM
We try to match the triggers as best we can for common Shopify URLs and Elements however there are a few optional tags/triggers that can be used depending on your own theme customization (ex. do you have quick view on collection pages?).
Each trigger contained in the GTM container that might need updating is labeled UPDATE ON IMPORT.
Utilize the worksheet that comes with the GTM container download to determine what you need to modify by updating YES/NO in the blue column.
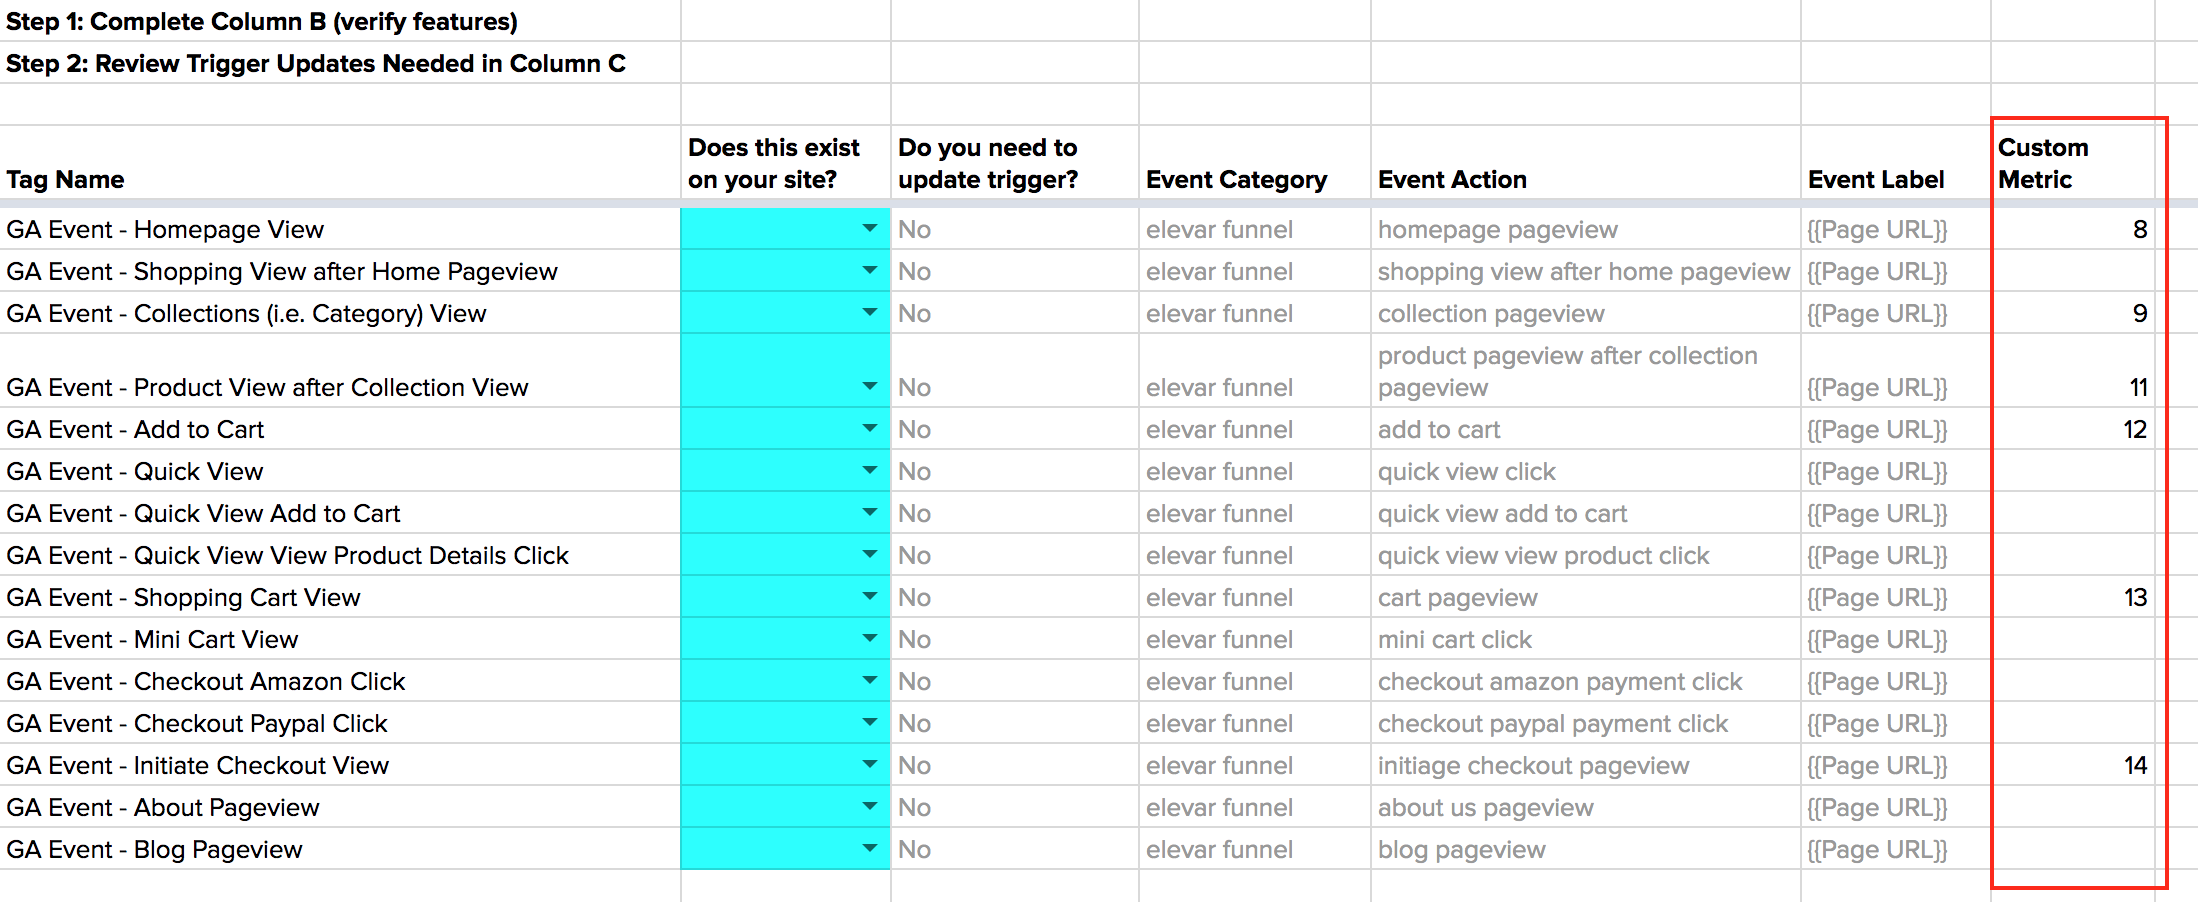
Here’s what it looks like:
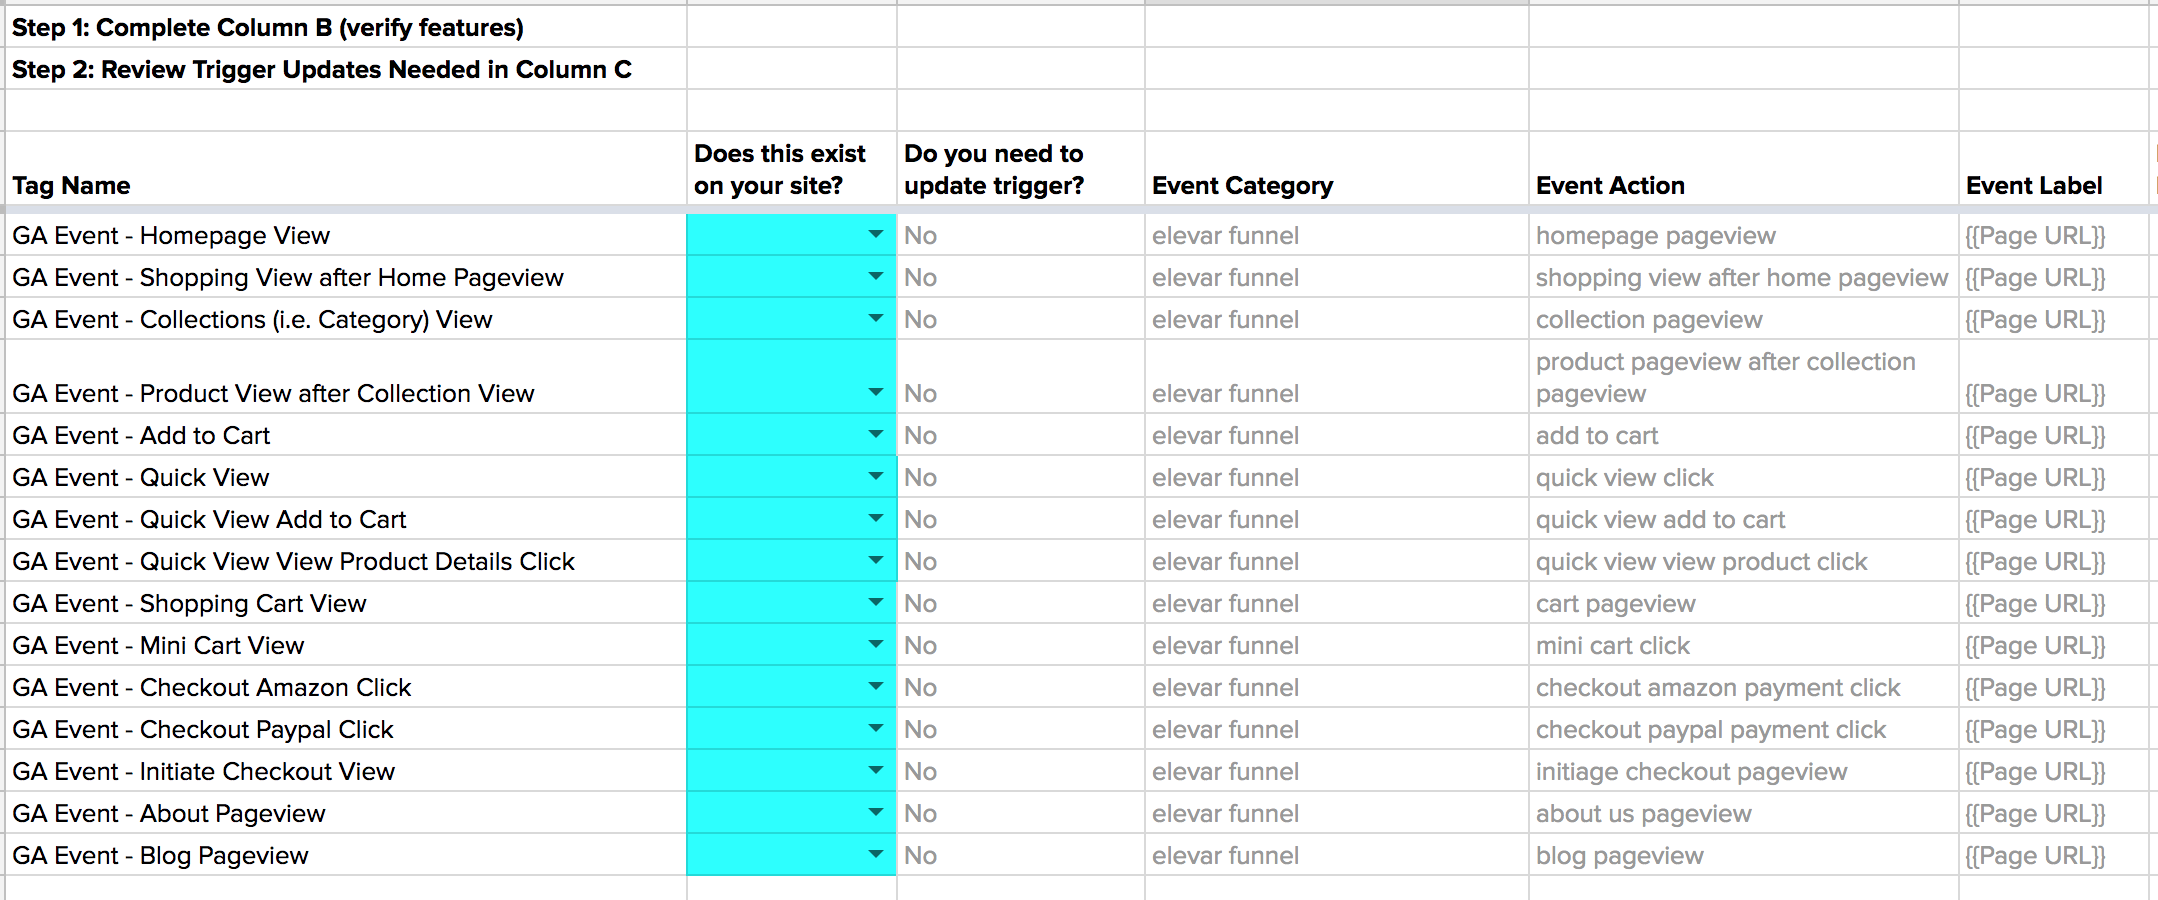
This will then update your column “Do you need to update the trigger?”.
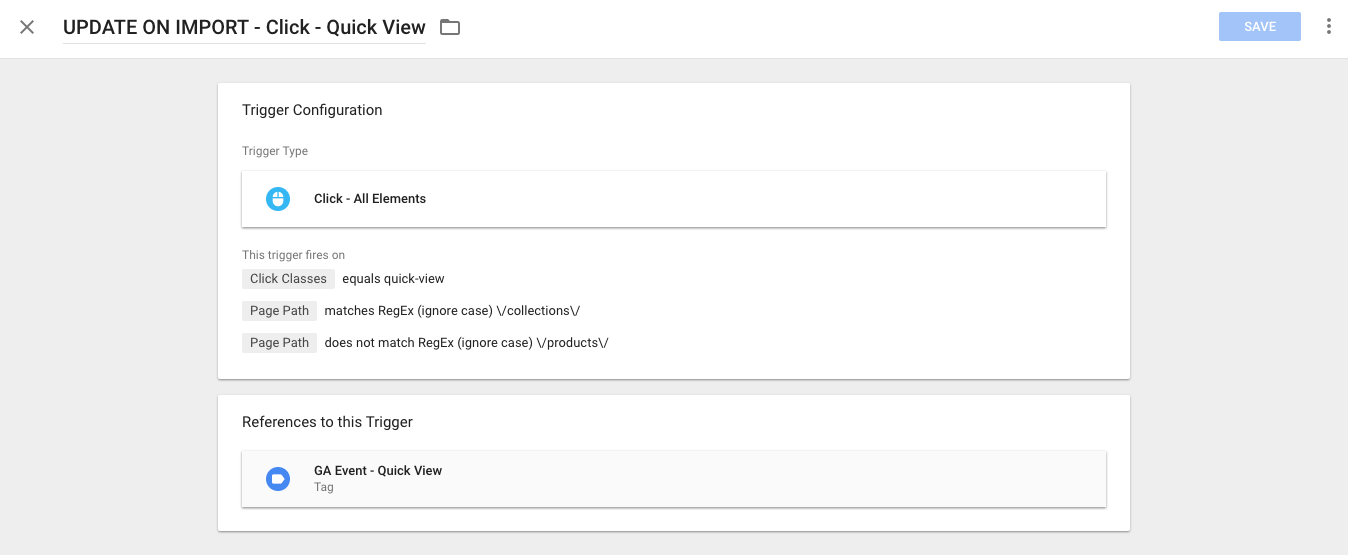
When you encounter Click Triggers that you do need to update (like the quick view example below), you will need to either grab the click class or click element that this triggers on your website.
If it’s a Pageview Trigger then you’ll need to change the matching URL (ex. About and Blog Pageviews).
If you’re not familiar with modifying triggers in GTM, I go into detail on how to find and update click classes in GTM in this how-to article.
Step 3: Create Custom Metrics in GA
I LOVE custom metrics in Google Analytics (recommended reading on custom metrics here). They amplify the value of custom events.
This is a required step in order to help build the foundation for some of the table report visuals.
In short what we need to do here is:
- Identify what tags (i.e. funnel events) are most critical to your conversion funnel success
- Create these custom metrics inside of Google Analytics (you’re limited to 20 metrics in total)
- Create calculated metrics inside of GA using these new custom metrics
In this screenshot you’ll see how I’ve configured custom metrics for one of our Elevar Pro clients that enable a custom report in GA that leverages these custom metrics (and a few calculated metrics sprinkled in :). ![]()
First step:
In your worksheet shown in the previous step, add another column and mark the events you want to track as custom metrics:
Then in Google Analytics you’ll need to create these metrics in Admin > Property > Custom Definitions > Custom Metrics:
![]()
If you don’t have any custom metrics yet then you might be starting at 1 for your first custom metric. These are very easy to create and all should be set to “Integer” with a minimum value of 0 and maximum value of 1.
Once you’ve created your custom metrics in GA you’re ready for the next step.
Step 4: Update Tags in GTM w/Custom Metric
Now we need to update each of these tags in GTM with the proper custom metric number.
Go to each tag inside of GTM that you’ve created custom metrics for and click “Enable overriding settings in this tag” => then select Custom Metrics => then assign the index number (shown in above screenshot).
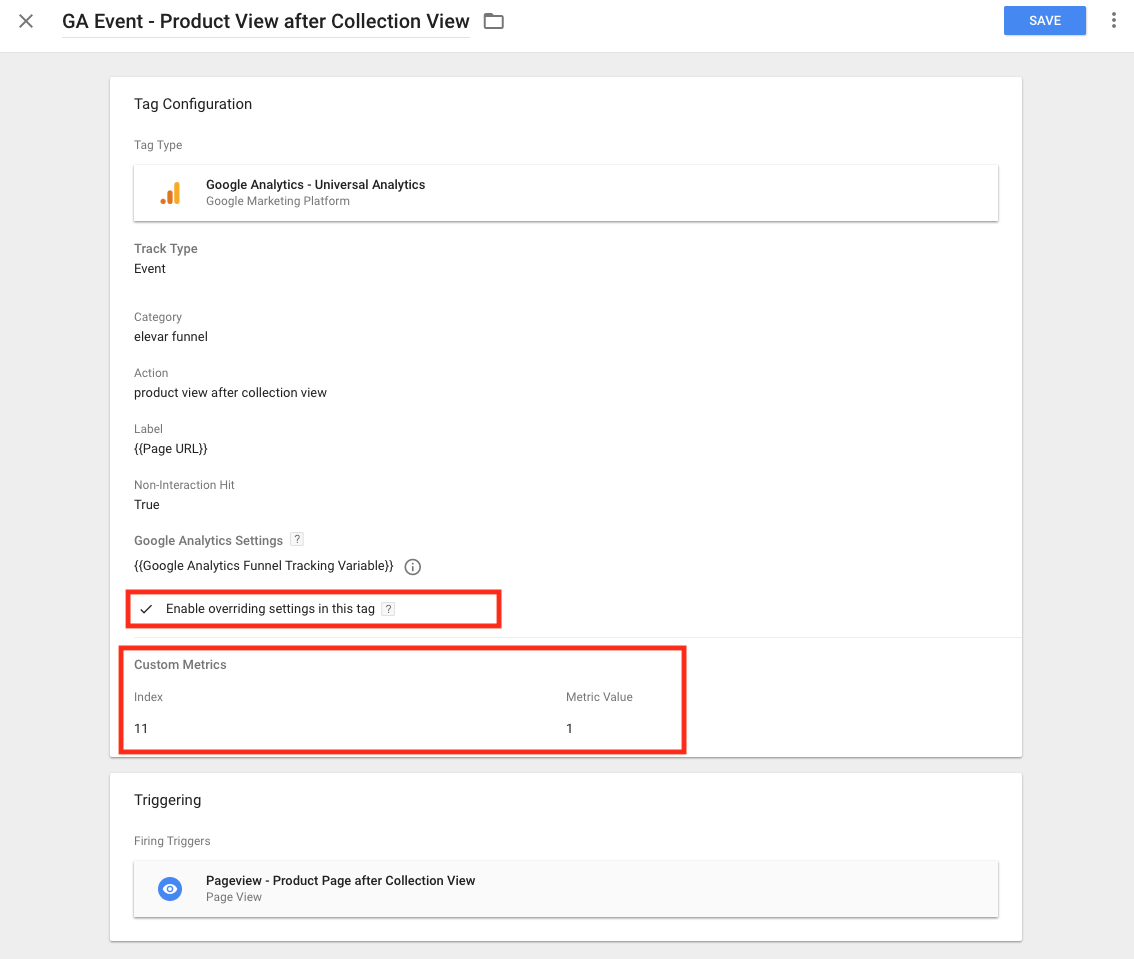
Once you’ve updated for every tag – you’re done!
Step 5: Test Tags in Preview Mode
Now you need to preview these tags on the frontend of your site to ensure the tags fire as you expect.
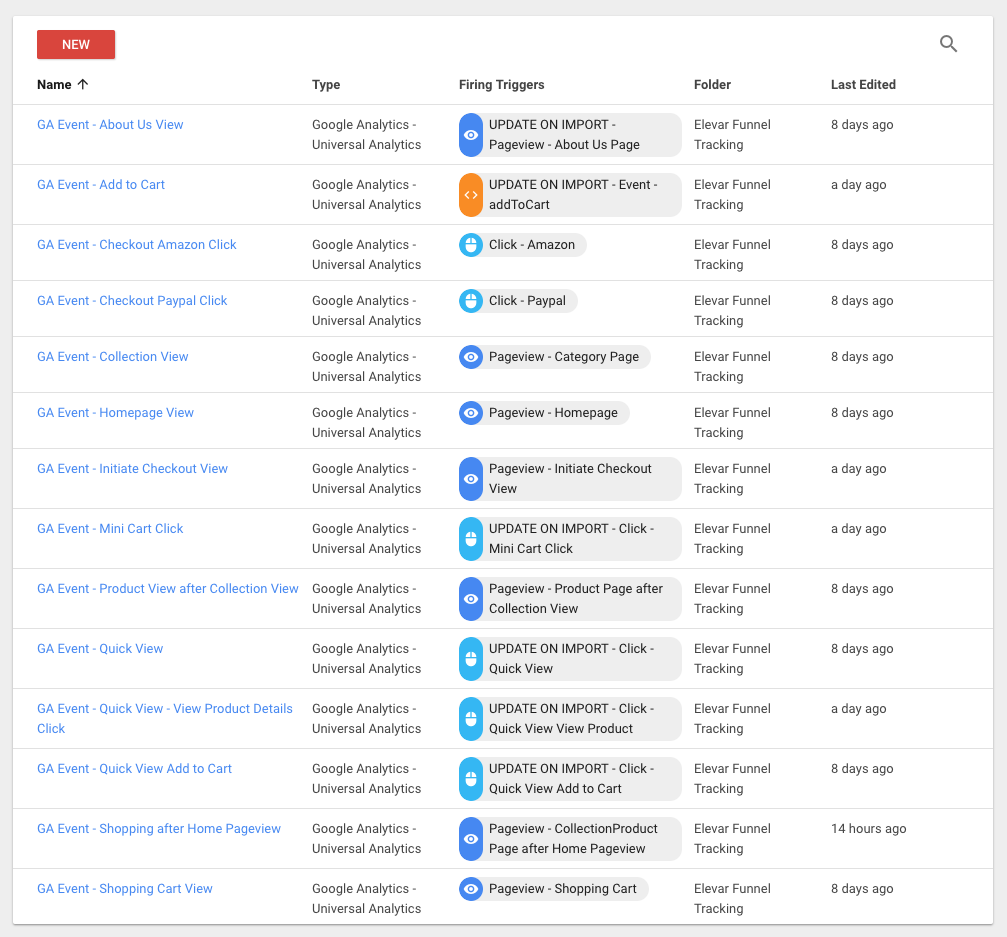
I won’t go into full detail on how to use Preview mode inside of GTM but each event should fire when you click the feature (e.g. quick view) or load the page (e.g. collection pageview):
Step 6: Update GA Variable and Publish GTM Changes
If all looks good – then you’re ready publish your changes!!
One quick thing you’ll need to do before data starts populating inside of GA is update the GA variable associated to each tag to be your own property UA #.
Go to Variables > Google Analytics Funnel Tracking Variable and update with your own Google Analytics property #. If you already have an existing variable that you’d prefer to use then you can delete this one and use your own.
![]()
How to Visualize Your Conversion Funnels
Now I’m going to show you how to create these reports in Google Analytics in addition to what you’ll see in your Elevar dashboard.
Tools you need:
- Google Analytics
- Elevar (create account here or request demo by submitting request in our live chat)
Google Analytics
You’ll want to give your data a few days to populate and you should start to see them appear inside of Behavior > Events > Top Events > Event Actions.
You can filter by “view” to see the event actions that contain pageview:
![]()
Shopify pushes some standard events to GA as well which are sprinkled in (and can be used as part of your funnel building as well!).
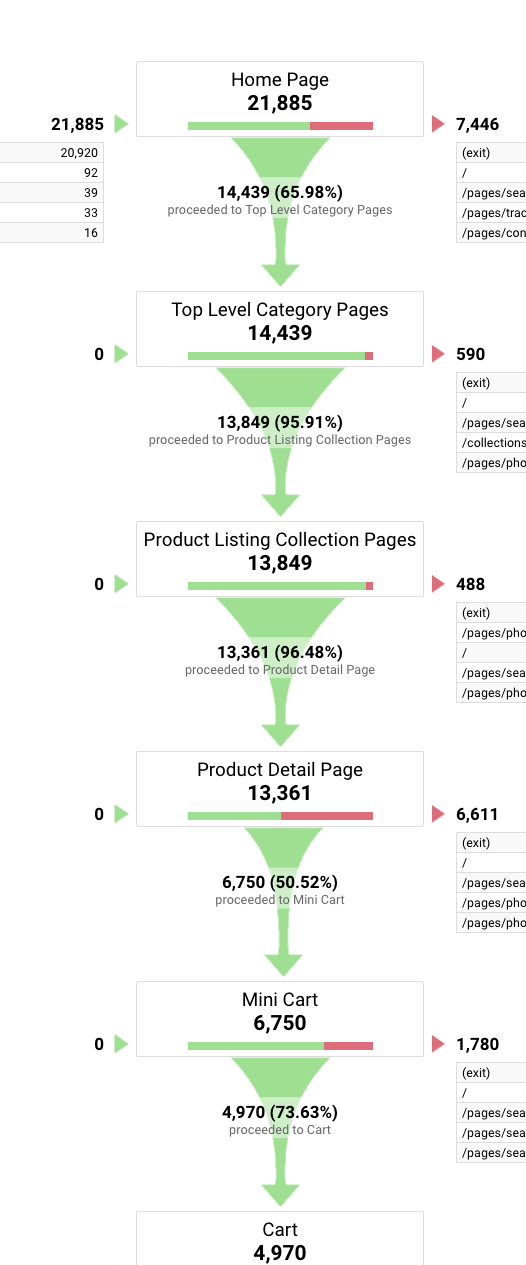
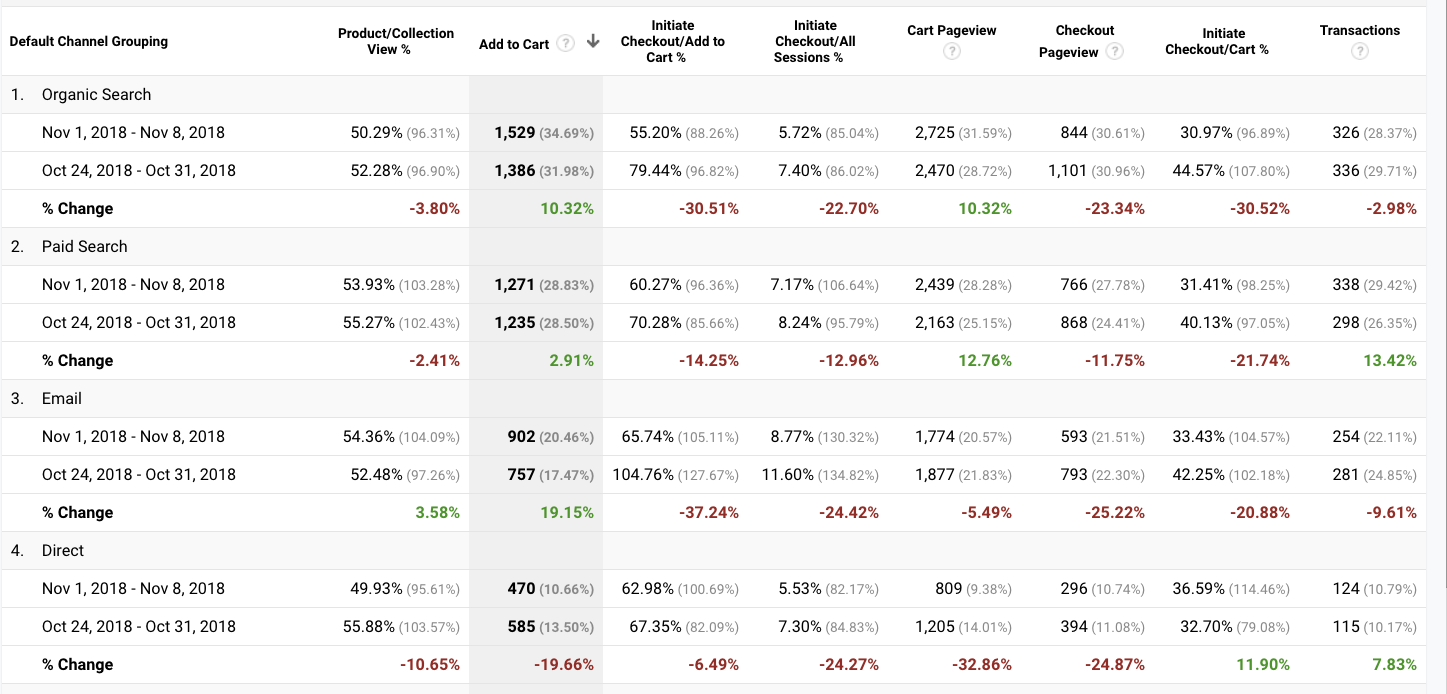
Then in order to get a report like this (click to enlarge) which is a full-ish funnel from home => transactions:
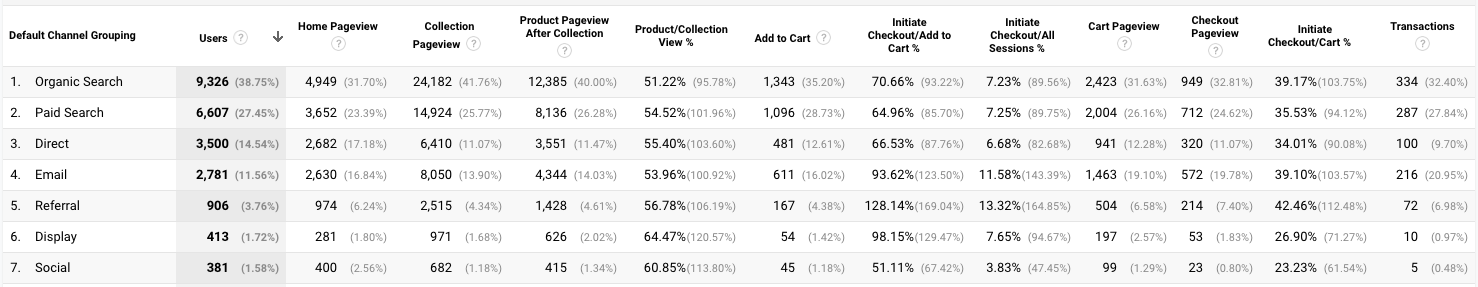
Or a similar one but is using a compare period to look for key changes:
(to me I’m seeing a great job increasing add to carts and getting users to the cart page but then it’s a pretty drastic fall off getting users from cart and into checkout across all channels. So that is where I would want to focus optimization efforts first)
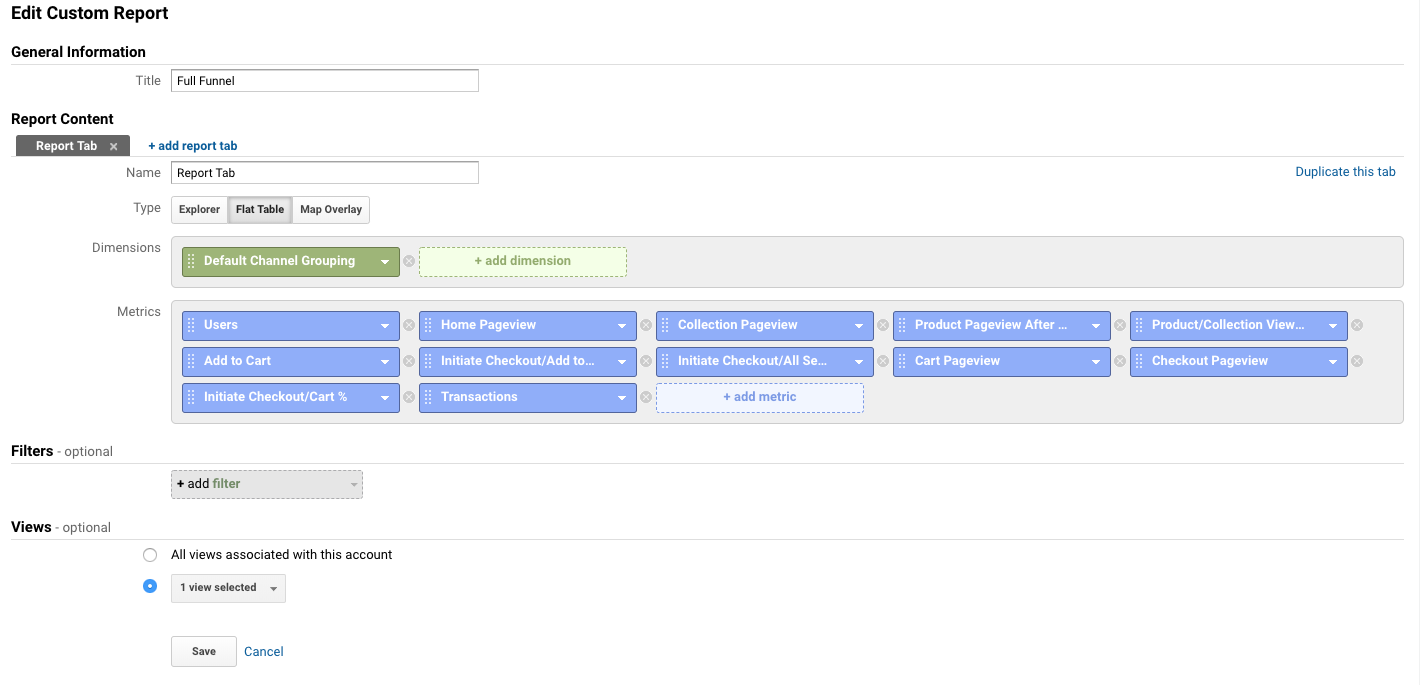
You’ll need to go to Custom Reports > Create New Report and select your preferred dimension and metrics as shown here:
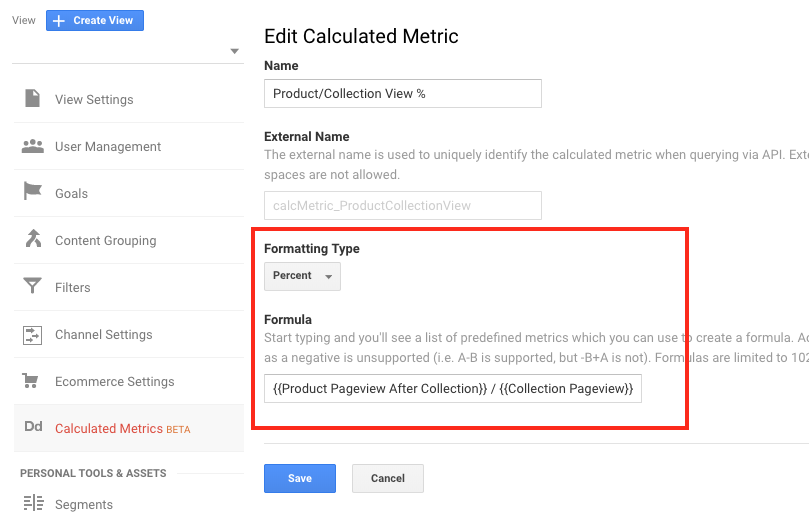
You’ll notice some of the data displays as % in the report which is done by creating a calculated metric in GA and dividing two of your custom metrics. Standard GA limits to 5 calculated metrics but they are a great way to visualize in ratio’s vs raw #’s:
Go to GA > View > Calculated Metrics:
You can create any number of reports for the micro-conversions listed above (ex. quick view to add to cart performance, etc) and analyze these by channel, campaign, time period, etc.
Elevar
If you’d prefer to leave the heavy lifting of report creation PLUS get quantify these key micro-funnel metrics into $$ then Elevar automates these activities for you.
Once we detect sessions that match the event actions from your funnel tags you will begin to see this data translate into insights within your dashboard like this:
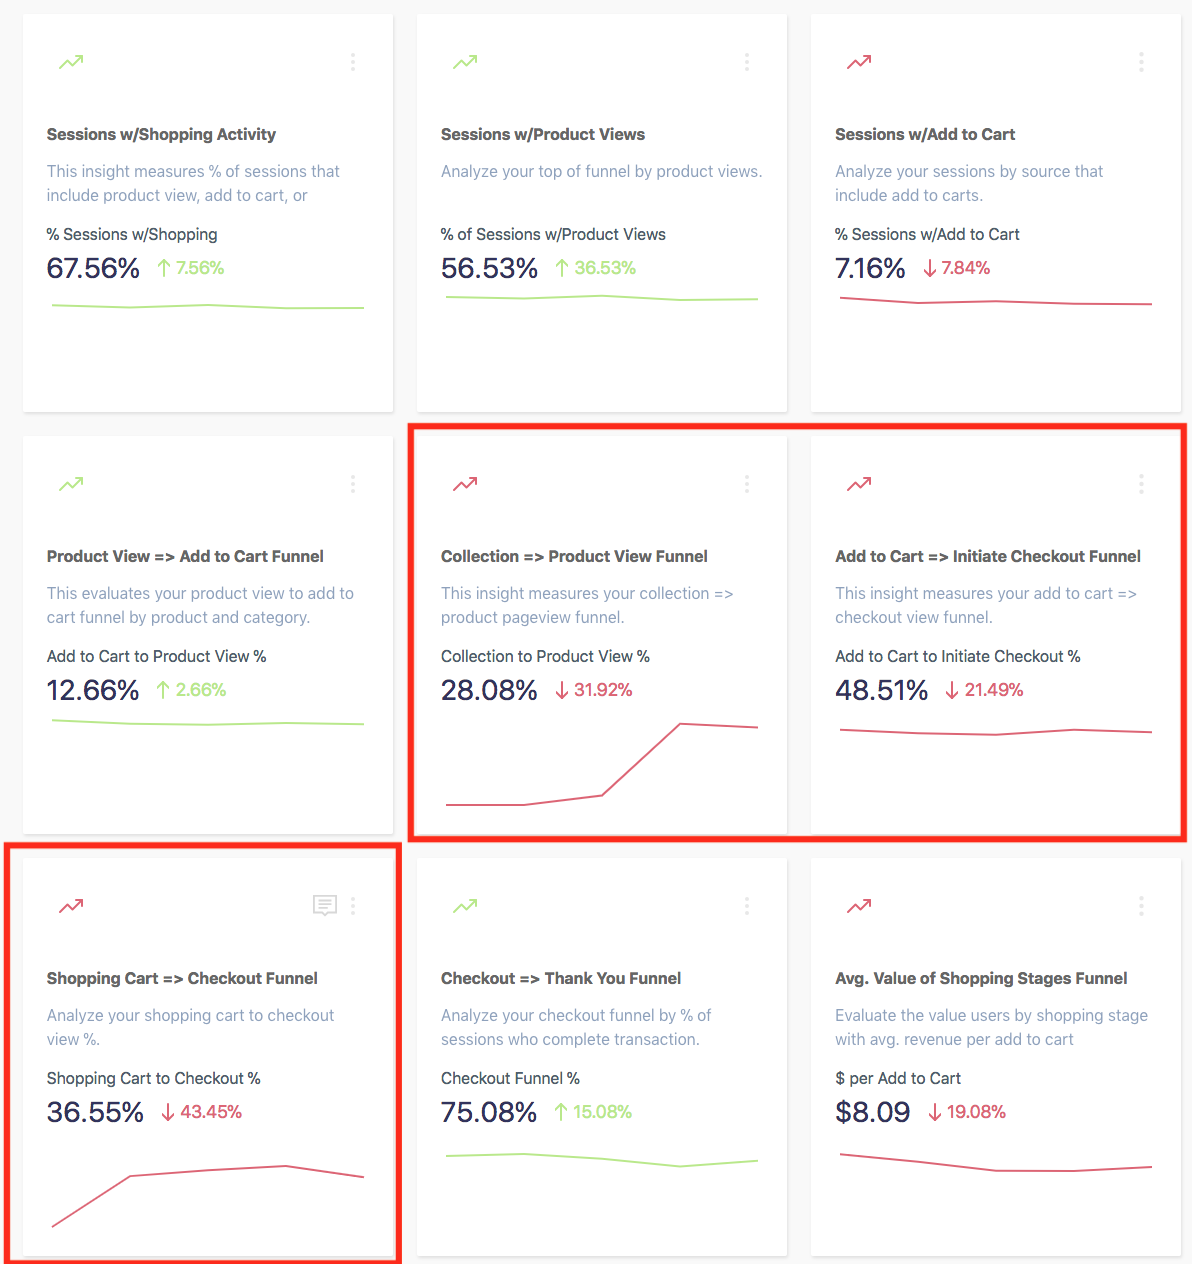
Using the add to cart to initiate checkout % insight – this is showing us that out of 100 sessions that add to cart, only 48 (48.51%) are actually making it to initiating checkout (which is 21% below the benchmark threshold).
So what?
Well, the goal of these funnel reports is to help provide insights on where to take action (i.e. make more money) on your site, right?!
Once you enable our Revenue Adjustment feature then all of the insights will translate into potential revenue lift to help you focus and prioritize on the biggest opportunity.
The way that Elevar calculates this is changing your % of session variable in the standard revenue formula of sessions x conversion rate x average order value and shows the difference.
So you know if you improve your Add to Cart to Initiate Checkout funnel from 49% to 70% then that’s an additional $75K in this time period.
Boom – that’s prioritization!
Conclusion
This is one of my favorite posts to date! I love finding creative ways to fill in gaps of our existing analytics tools.
You now have a framework with sample tags to create your own amazing eCommerce conversion funnel for your Shopify store leveraging GTM + GA + Elevar.
I’d love to hear your ideas on other funnel tracking ideas – leave them in the comments below!
Also – all of our ELEVAR PRO customers receive this custom GTM funnel creation as part of onboarding. If you’re interested in learning more send me an email at [email protected] or send us a chat to the right.
Happy funneling!

Download GTM Container and Worksheet
Click here to download this full funnel GTM container and tag worksheet to get you started.

I’m unable to download this, signed up several times but the email never arrives
I use a third-party checkout how would the setup for example?