5 Awesome Paid Search Reports in Google Analytics to Help Grow
Build your own reports tracking net profit, negative keywords, long tail success, assisted keyword conversions and more.

See what I did there? The most click-baity title I’ve written to date. A small part of me inside has died. It’s taken 5 minutes to write this first sentence because I’m so shaken up.
….
When new users join Elevar they are treated to an automated analytics audit (say that 3 times!) across all of their marketing channels – including Paid Search.
I love hearing feedback when one single insight helped saved thousands of dollars for a business. Or even better – that they never thought this data was available in Google Analytics!
In this article, I share how you can create custom AdWords paid search reports for yourself or for your clients.
1. Negative Keyword Report
This report pulls all search queries that you’re spending money on but have produced a total of $0 revenue (via last-touch attribution*).
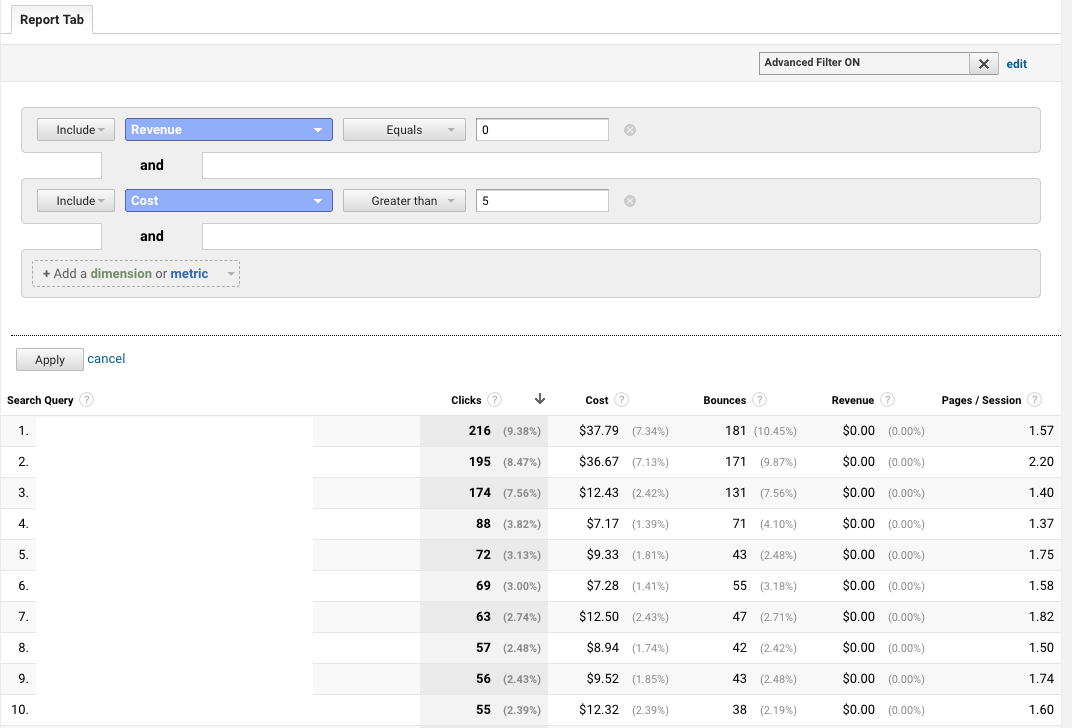
How can you use this report?
If any of these queries are irrelevant, I encourage you to add these as negative keywords to your campaigns. Negative keywords prevent your ads from appearing in results that are close matches, but irrelevant.
Taking action on this means saving money from wasteful costs while also improving the quality of your ads.
Example: Let’s say you’re an optometrist who sells eyeglasses. In this case, you may want to add negative keywords for search terms like *wine glasses* and *drinking glasses*.
Here’s how to create the report by going to Google Analytics > Customization > New Report:
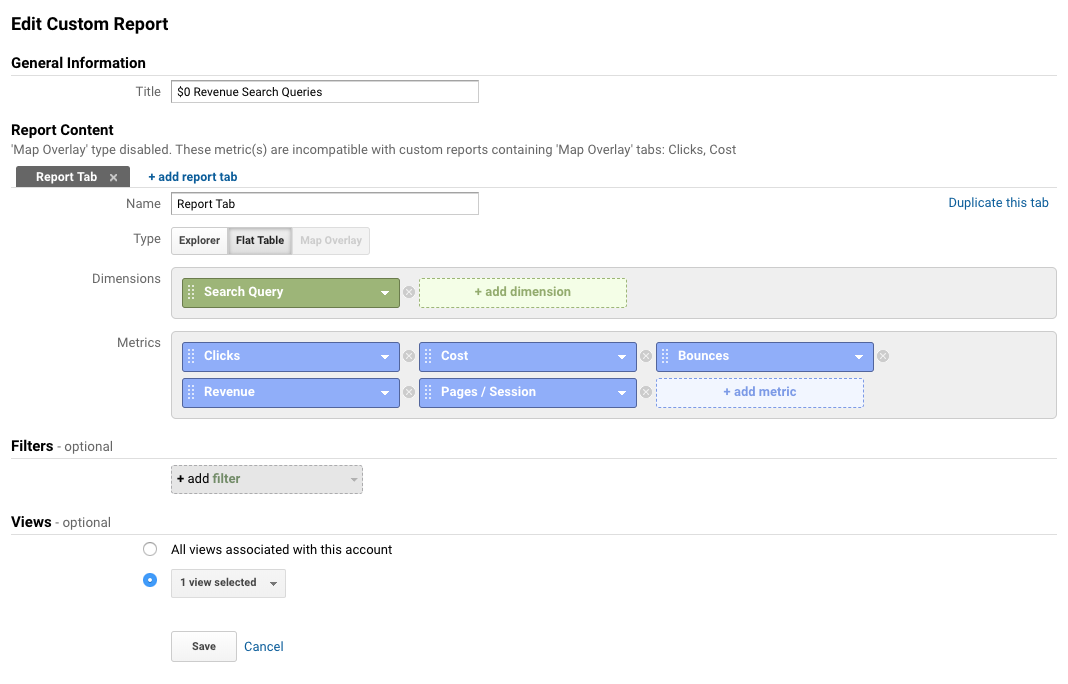
And once you’re viewing the report, set the filters shown in the first screenshot to start saving you millions (well, maybe not millions, but you get the point).
2. Poor Performing Landing Pages by Search Query
This is a similar report of searches performed by users except we’re focusing on landing pages.
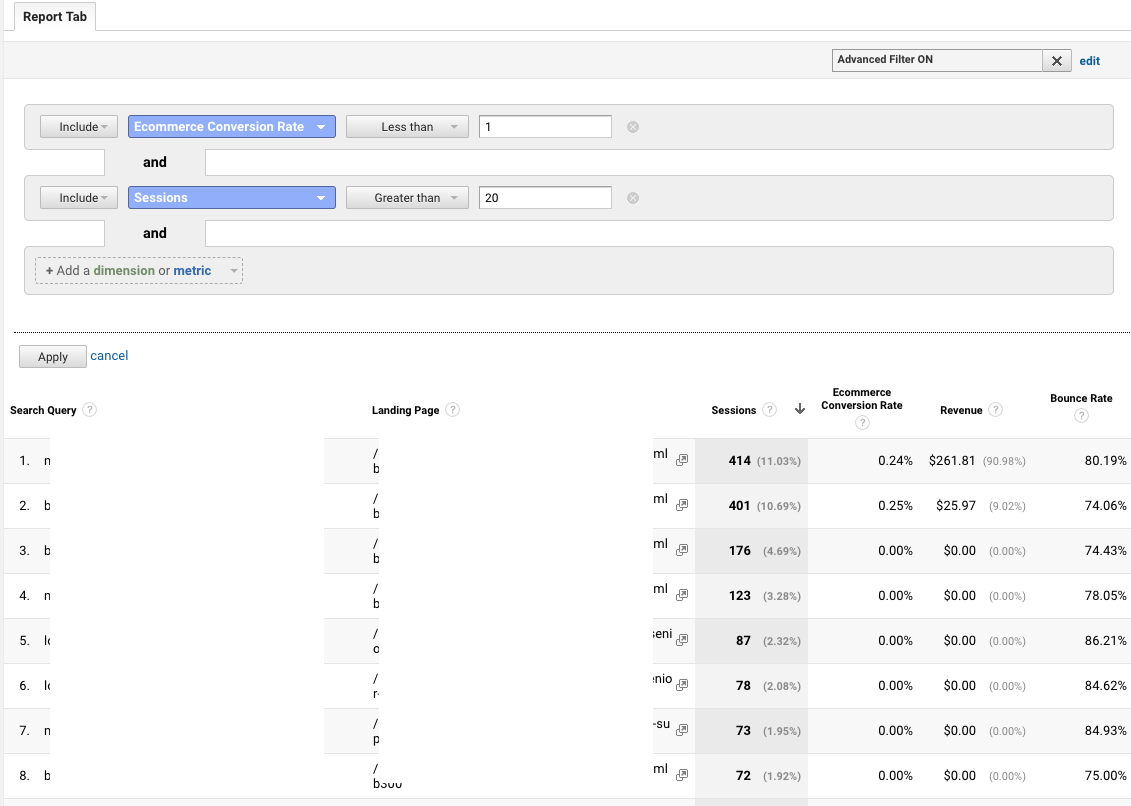
How can you utilize this report?
This report aggregates landing pages from across all of your ad groups – so if they’re performing poorly globally, then it’s a strong sign it could use improved optimization & personalization. Review those pages with a high volume of sessions first, and dig into each with these questions:
Is the content on the page relevant to the ad? Is there clear value displayed to the user? Are there unnecessary distractions for the user (i.e., pop-up modals?) that can be a/b tested to see if they’re helping or hurting conversions?
Here’s how to create the report by going to Google Analytics > Customization > New Report:
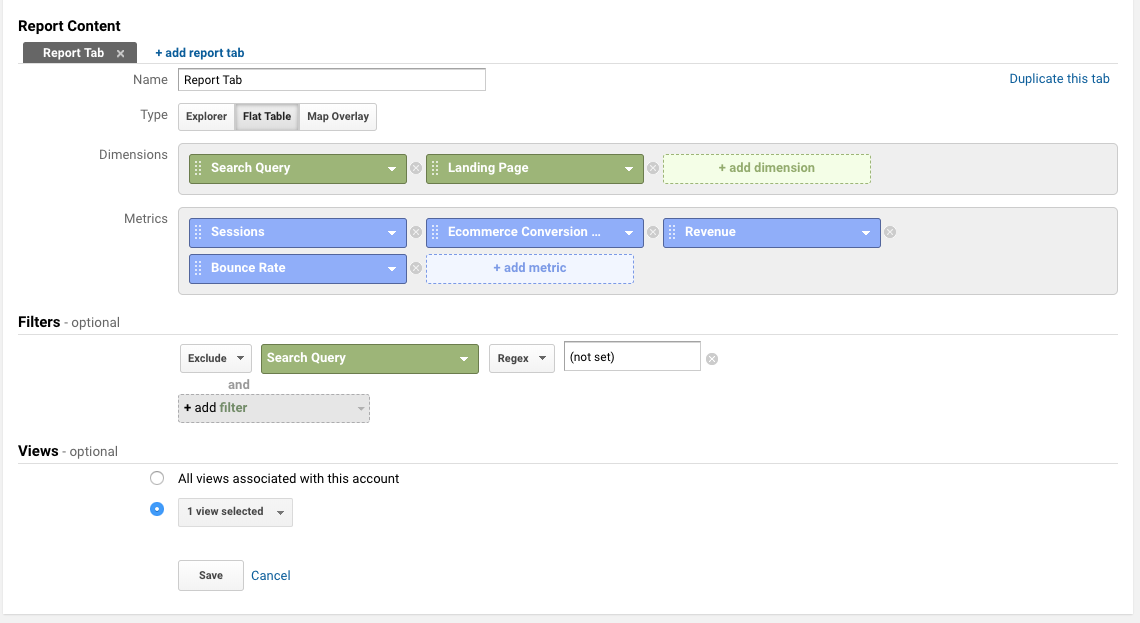
And once you’re viewing the report, set your filters to start optimization heaven.
Adjust filters to fit your specific scenario. For example – I used 1% as my high end conversion filter but you might need to go higher or lower based on your aggregate conversion rate.
3. *Search Query Multi-Touch Attribution
We’ve really beat up on search queries in the first two reports that aren’t driving any last-touch revenue.
But – we live in a multi-touch world now where users don’t convert on their first visit. So before you start cutting 80% of your keywords or campaigns 🙂 take a peek at your assisted conversion report by search query.
We’re diving into the Multi-Channel Funnels reporting in Google Analytics and more specifically the Assisted Interactions Analysis report.
I’m going to set my primary dimension to “Search Query” along with a few filters like this:

Now after I sort by $0 last-touch revenue I’m left with a view of search queries that are driving assisted conversion value.
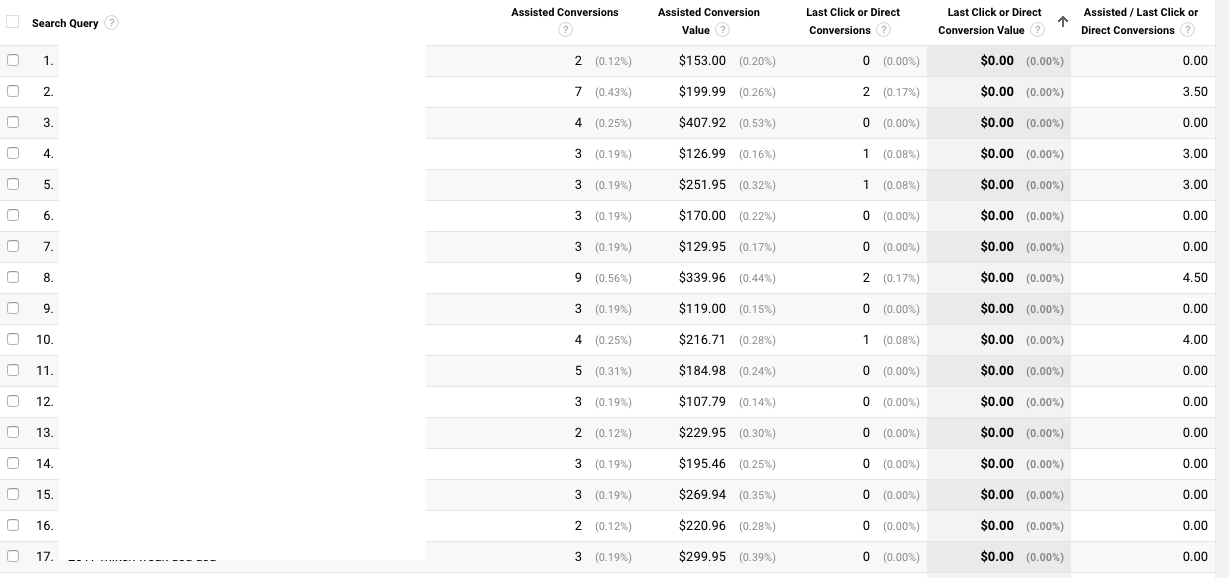
So, if I pair this with a similar report by keyword/campaign then I can start to understand what keywords and search intent are driving more top-of-funnel traffic vs true last-click “I want to buy this now” Google search intent.
4. Long Tail Paid Search Performance
The query length report contains the search query length, in total # of words, which users have typed into Google > then viewed your paid search ad impression > and then clicked on an ad to visit your website.
Here’s how to create this report:
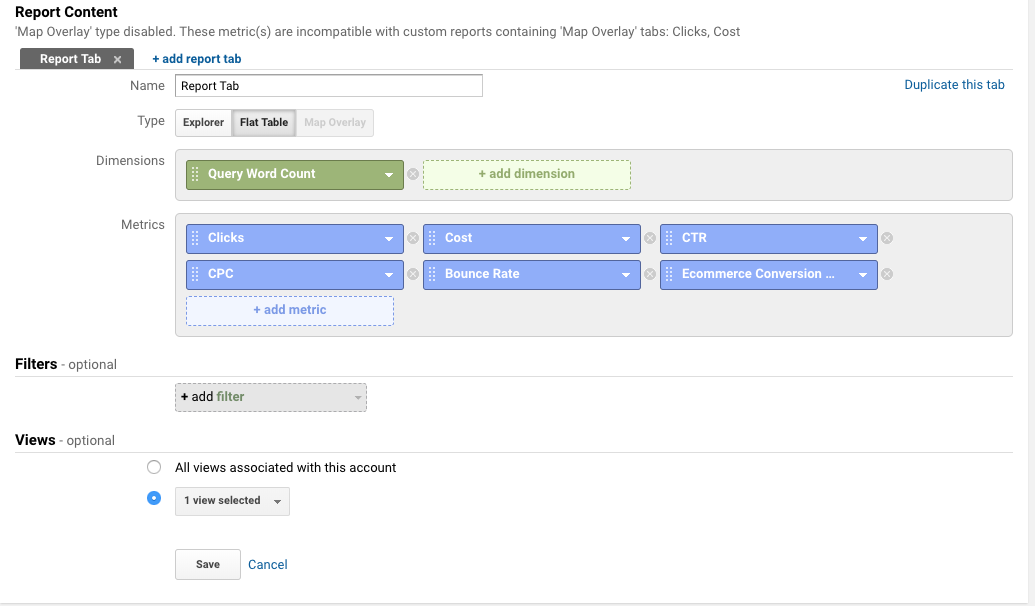
And here is the result of this report in all its glory:
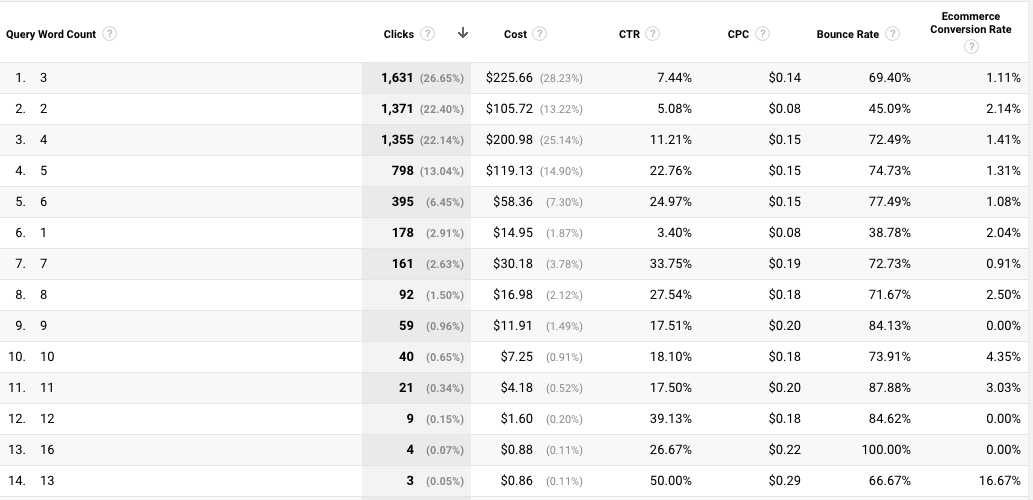
In general, the shorter the query length the more broad the search term is, whereas the longer queries aka long tail are a stronger signal for specific intent by the user.
How can you utilize this report?
If you aren’t performing well (in volume of sessions or revenue) in long tail queries, then you may want to look at ways to enhance your long tail targeting through paid and organic search.
If you’re using Elevar then you can set a target % to track your long tail to head term revenue ratio:
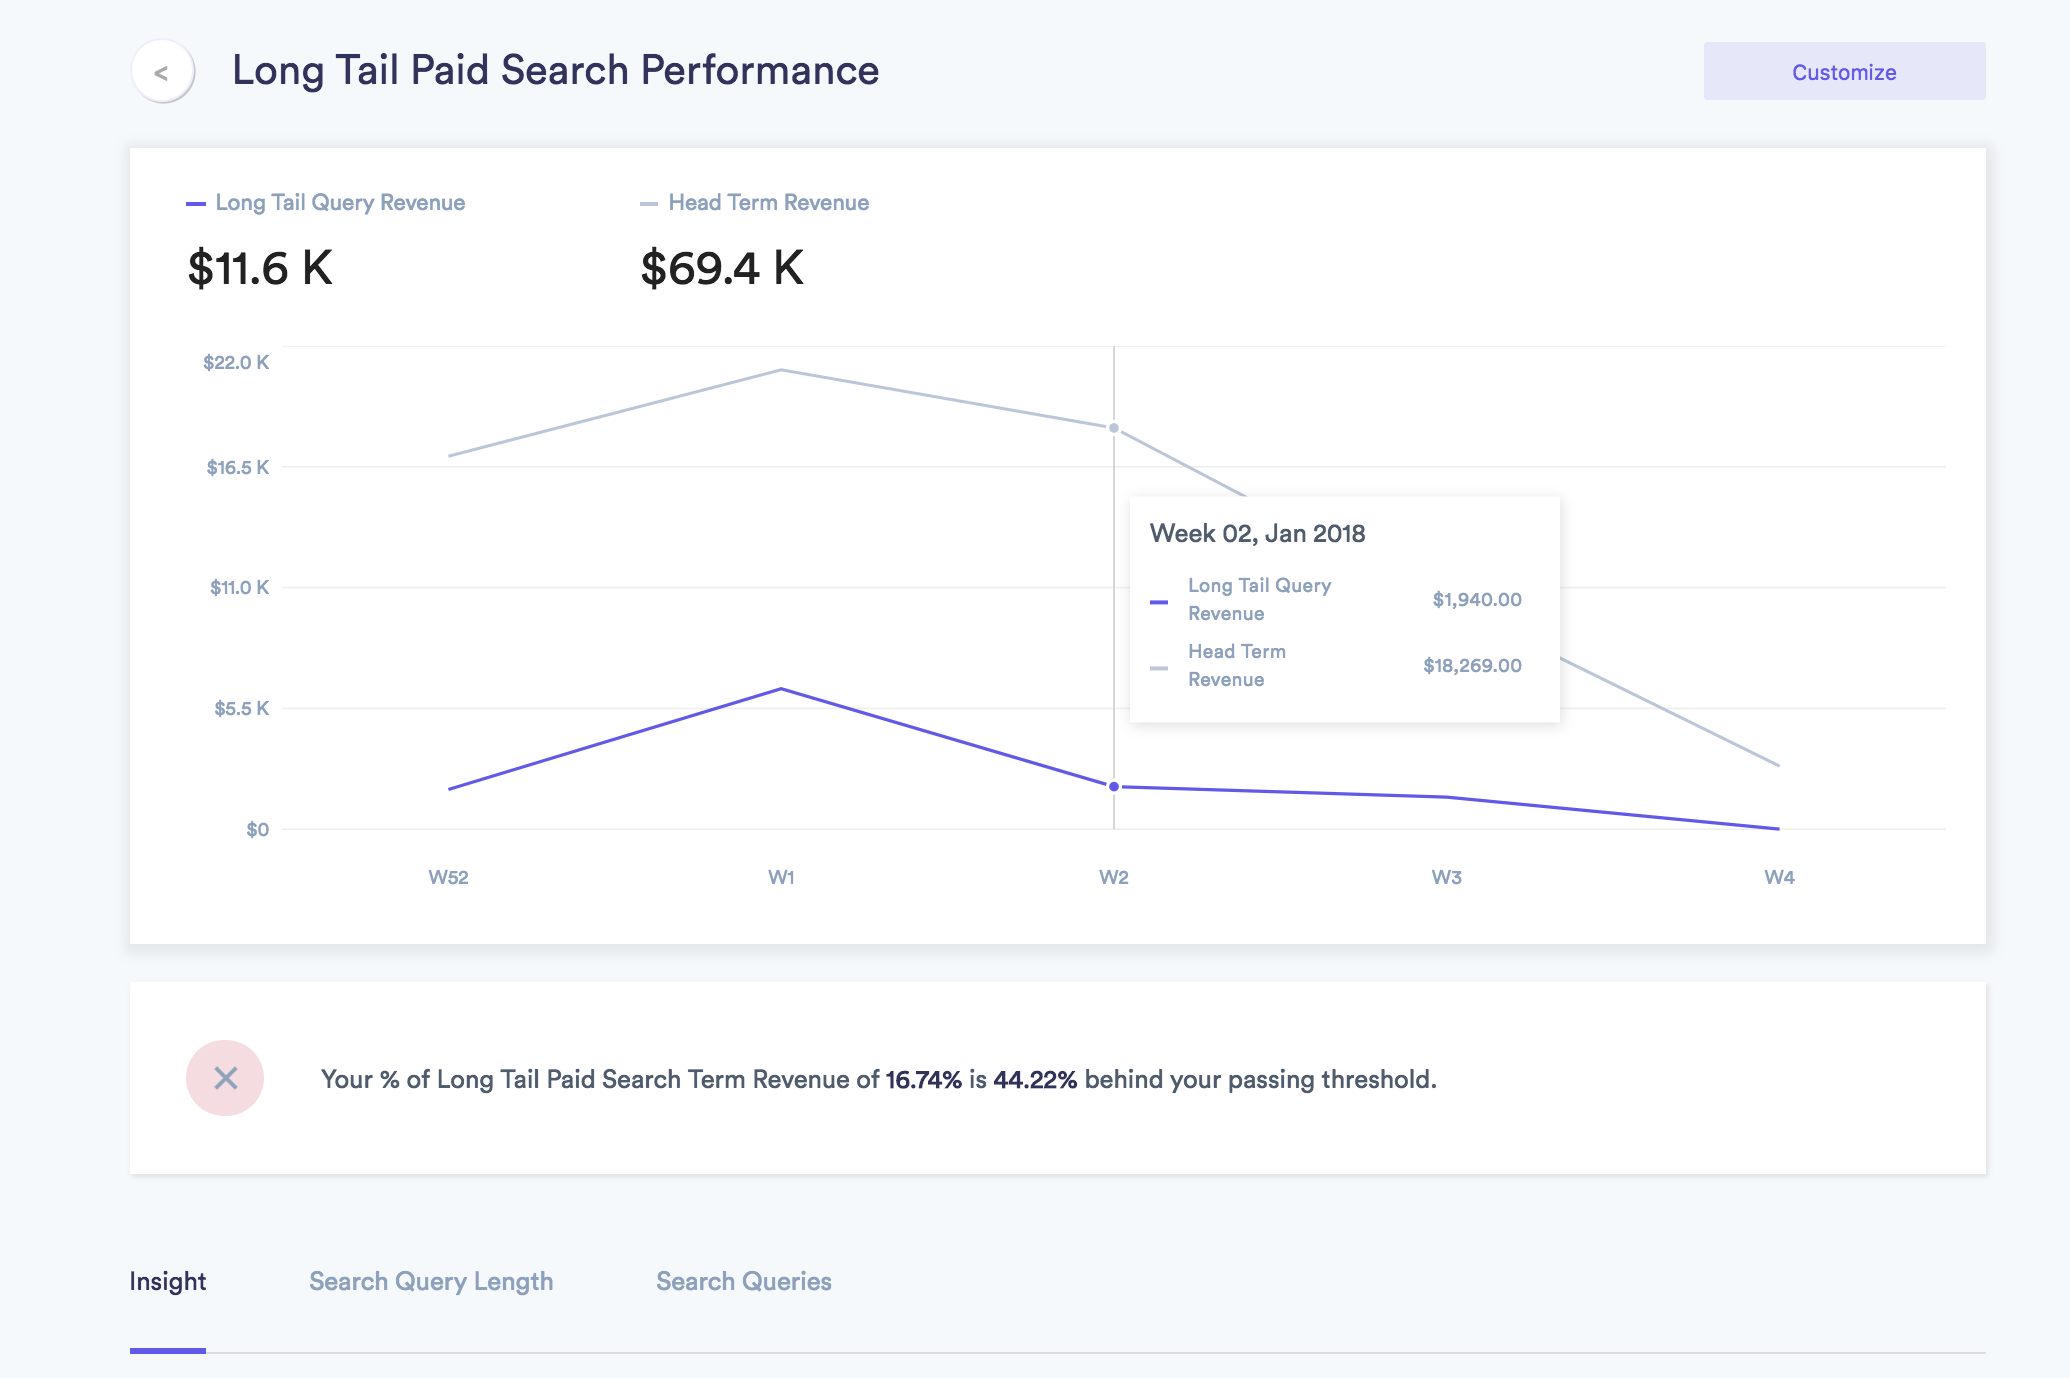
Long tail search queries are generally less competitive so you could have opportunities for higher ROAS. And you will benefit from the likely growth of #voicesearch results as well.
5. Net Profit by Keyword
Ahh, yes, the report that rules them all. I’ve written a guide on just this report alone because I love it so much: how to track gross margin and net profit in Google Analytics.
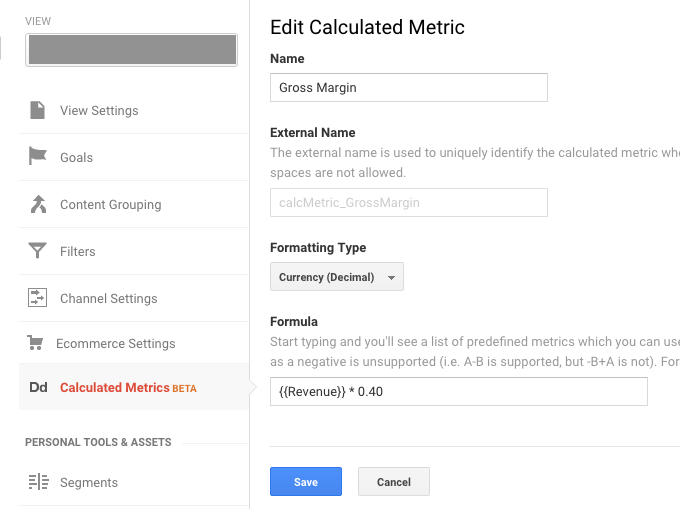
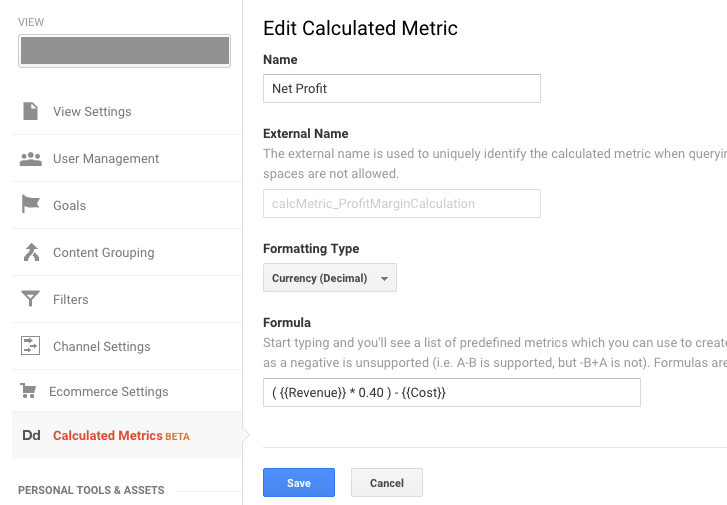
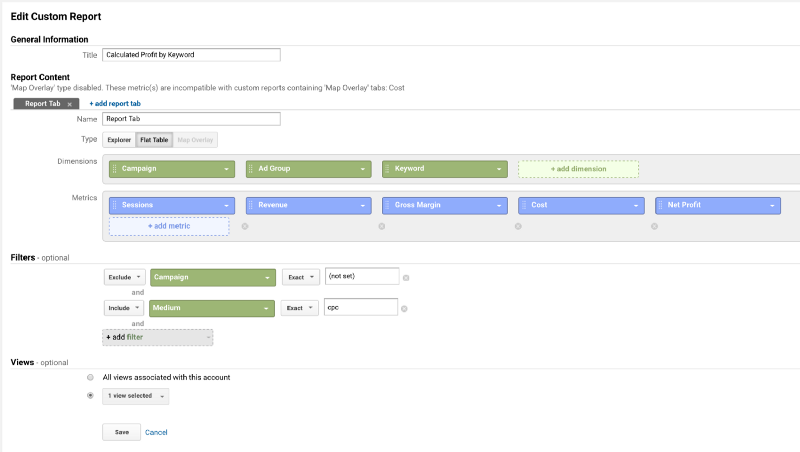
This report compiles an estimated cost of goods AND your AdWords cost to give you a row by row report of keyword net profit.
There are two steps required before this report will work for you:
Create a calculated metric called “Gross Margin”:
Create a calculated metric called “Net Profit”:
And then you’ll configure your report like this:
Which results in a beauty of a report like this:
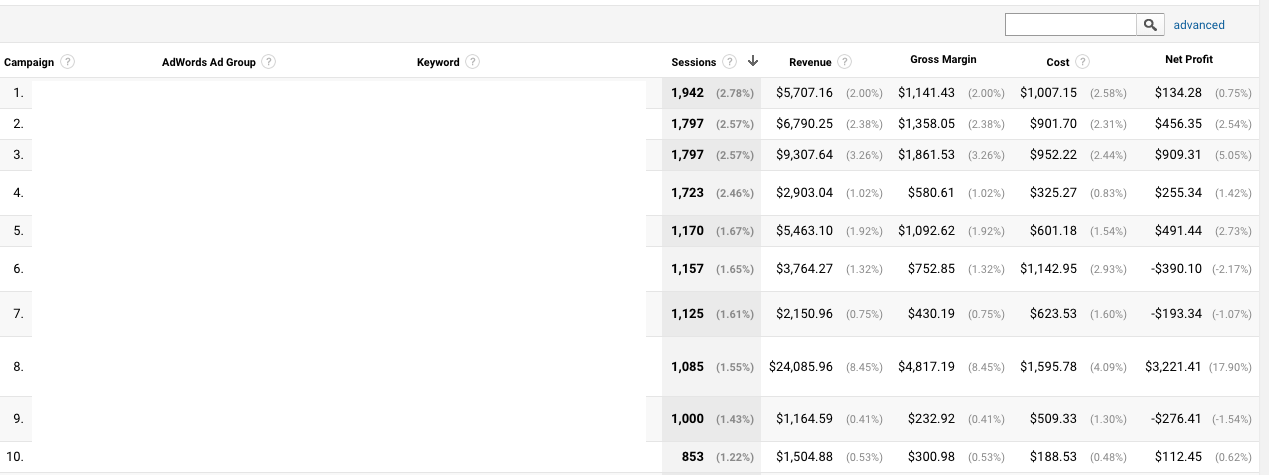
Just imagine the bid management decisions you can make with this report!
Now – 40% may not be the right COGS variable for you so adjust as needed. And this report really amazes when you get actual COGS by SKU 🙂
Wrapping Up
These five AdWords reports for clients or your own use can help discover hidden opportunities to cut costs or implement new strategies.
If you need help creating paid search reports like these for your business – send me a chat – I’d love to learn how we can help.
Happy paid search reporting!
Related Articles:

Very good info. Lucky me I came across your blog by accident (stumbleupon).
I have bookmarked it for later!