How to Track Net Profit and Gross Margin in Google Analytics
Learn how to make paid search ROI analysis more accurate using calculated metrics in Google Analytics.

Brad Redding
Brad Redding is the Founder & CEO of Elevar. Specializing in analytics, tracking, GTM, and conversion optimization.
In this how-to, I explain:
- Definitions of gross margin and net profit
- How to create gross margin and net profit metrics for your business in Google Analytics*
- Why these metrics are important and how you can use them
If you are a consultant or contractor (i.e. agency hired by client) then bringing this type of data to your ongoing reports and roadmap discussions will create more meaningful (and accurate) discussions.
If you’re a business owner or responsible for company income and margin reporting, then you already know the potential value in having margin and profit data available in Google Analytics.
Related Article: How to track net profit by SKU with paid search shopping costs.
Definitions
Gross Margin: Gross margin is your total sales revenue minus your cost of goods sold (COGS), divided by total sales revenue, and expressed as a percentage.
$100,000 revenue minus $60,000 COGS = $40,000
$40,000 / $100,000 = 40%
Net Profit: aka “the bottom line” is your total sales revenue minus your total expenses.
$100,000 revenue minus $60,000 COGS minus $10,000 advertising costs minus $20,000 operating costs =$10,000 net profit
In the example below we will only utilize Ad Cost from Google Analytics in addition to COGS to help get to a close(r) Net Profit number.
How to Create Gross Margin and Net Profit Metrics
For this how-to example, I’ll narrow the focus to paid search keywords.
This will help us see what keywords perform better than others. Step 3 can also be applied to any other marketing channel, if you have the costs available.
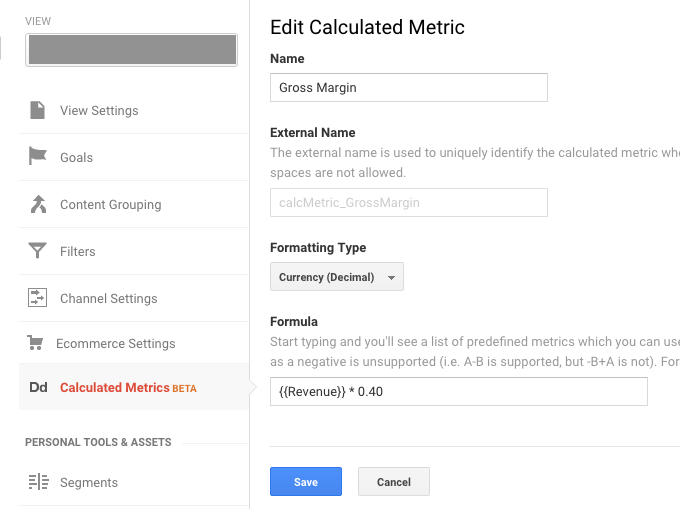
Step 1: Create “Gross Margin” Calculated Metric
In your Google Analytics, select Property > View > Calculated Metrics. Create a new metric with the following settings below (change the 0.40 to your own average gross margin %):
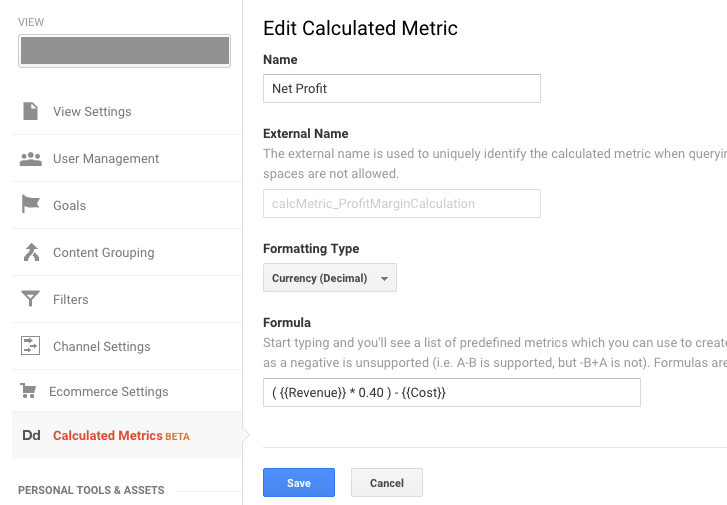
Step 2: Create “Net Profit” Calculated Metric
Create a new metric with the following settings:
Step 3: Create Your Own Custom Report
Create a new custom report with the following settings to unlock this new data:
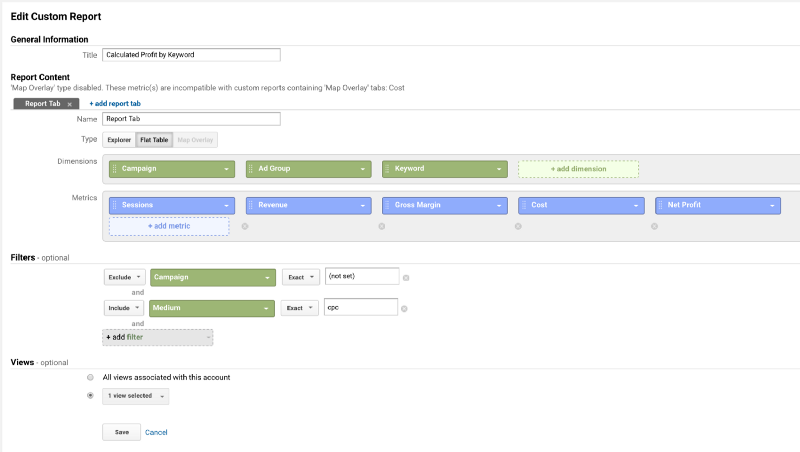
The cost metric assumes you have AdWords already connected to Analytics (which you set up under GA > Property > AdWords Linking) otherwise it will return as $0.
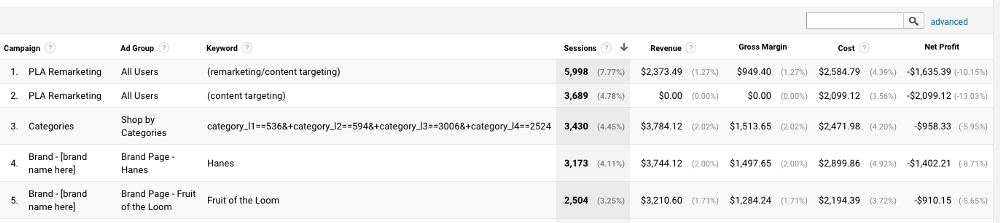
Here’s what the report looks like:
To add this report to your own Analytics account you can download this report from the Google Analytics template gallery I have created.
Obviously it’s pretty rare that you’re going to have the same gross margin % for every single SKU, but this is an extremely quick report to help you spot major issues if you have thousands of keywords that could be flying under the radar.
Why is gross margin and net profit important?
Unlocking this type of data is only the first step — now it’s up to you to take action.
In this specific example report above, I have actionable data to make changes to my paid search campaigns. Here are some of my options:
- Adjust my cpc bid down for keywords that I’m losing money on to reduce my overall cost.
- Optimize or a/b test landing pages for these keywords if they are underperforming (via revenue per visitor) when compared to other landing pages.
- Are there bundling or tiered pricing strategies that can be implemented to increase the AOV for a specific brand/keyword? For example — offer reduced price if a user purchases > 3 quantity of a Hanes t-shirt pack.
- The example report doesn’t display a high net profit keyword, but if it did then you might consider ramping up spend on these keywords that are your unicorns.
- If you can’t show a profit even after testing/tweaking your strategy for a keyword then it might be beneficial to cut these from paid search spend. While this will reduce your top line revenue #’s, your bottom line margin should improve.
What ideas or takeaways do you have in circumstances like these?
*If you have a fully functioning Enhanced Ecommerce implementation setup then you can begin reporting on these metrics by individual SKU.
Good luck!
Related Articles: