How to Create Your Own Custom Attribution Model
Learn how to create your own custom attribution model to help you understand how your channels are really performing.
Brad Redding
Brad Redding is the Founder & CEO of Elevar. Specializing in analytics, tracking, GTM, and conversion optimization.
Attribution – the bane of many marketers’ existence.
There are so many factors that impact our ability to attribute conversions:
- Cross device tracking (or lack thereof)
- Browser’s ITP regulations (i.e. deleting/blocking cookies that marketing software relies so heavily on)
- GDPR (opt-in only tracking)
- Broken tracking
- Different attribution model tracking (like comparing AdWords to GA)
- ….
And this is just looking at last-click (or just any!) conversions.
When you need to analyze conversions using a different model like first click, linear, or others then the water is even more muddy.
This article won’t go into specifics on how to fix broken tracking but I will show how you can create your own custom attribution model inside of Google Analytics to help provide another angle to analyze your purchase attribution.
Please use this process at your own discretion – it might not be the best fit for your business and certainly has subjectivity with it!
Download and make a copy of the attribution worksheet to follow along here.
Build Your Model Foundation
Step 1: Determine the stage of your business
Growth stage often determines KPIs for marketing measurement, which in turn affect how credit is split among interactions prior to purchase.
In our worksheet we offer 3 options, however you might have others you’d like to add:
- Startup & High Growth
- Measured Growth & Consolidation
- Renewed Growth by Implementing Changes
Step 2: Are you a brand or retailer
This is a simple yes/no question! But it can change the way marketing process and attribution works.
Some retailers also have lines of branded products that they produce. However for purposes of this question, such companies should select “Retailer”.
Step 3: How active are you with prospecting?
Heavy prospecting must be taken into account in an attribution model. An organization focused on acquisitions probably needs to weigh first touch heavily.
Why? There is such a wide net being cast that finding the right customer and channel fit is so important to control cost per acquisition costs.
- Yes, we focus much of our ad spend on bringing in new customers.
- We have a balanced approach of acquisition and retention marketing.
- We have a large existing customer base that is responsible for most of our revenue.
Step 4: What is your most important metric?
This is one of the most important factors in weighting interactions that occur at different points in the buying journey.
- Traffic and awareness are most important to us.
- The cost to acquire a new-to-file customer is of primary importance to us now.
- It’s most important that we demonstrate growth in top-line revenue.
- It’s most important that we generate an acceptable ROI/ROAS on our advertising spend.
Select Base Model
Now you’re going to take your answers to the four questions above and find where your answers match in the table.
You’re going to need to view the worksheet to find one of the 72 combinations your answers fit!
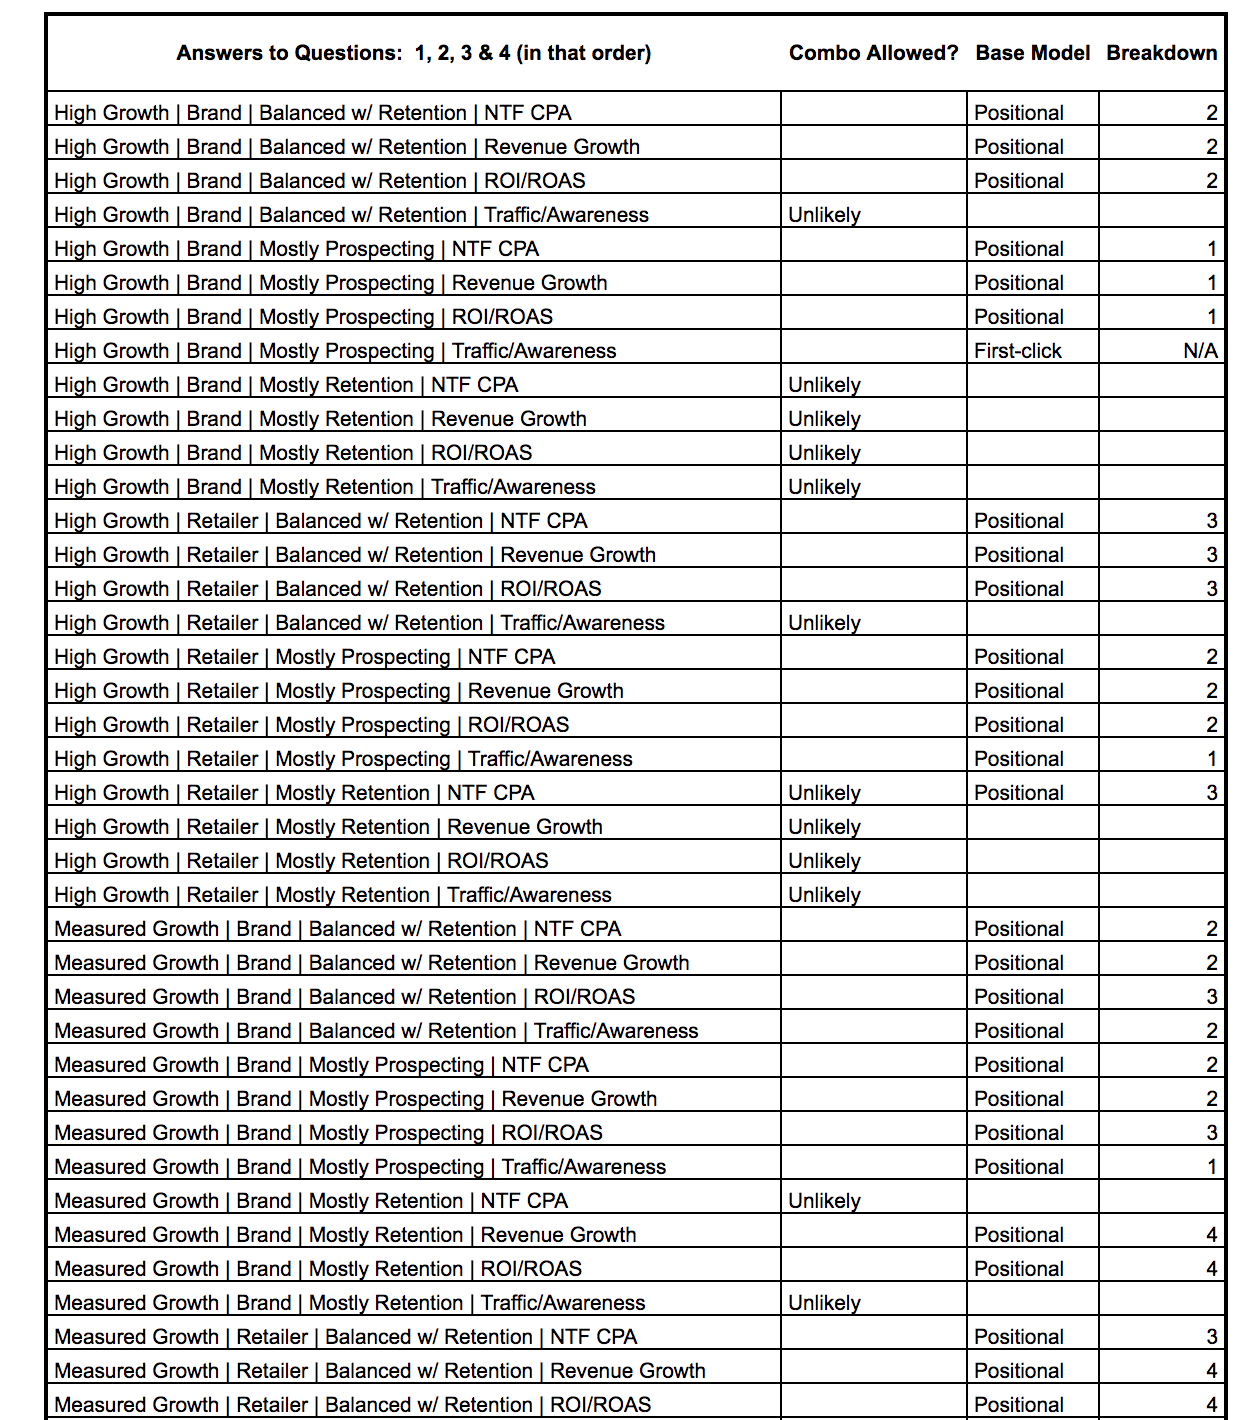
From here you will find a match in the 4th column that is:
- Empty (combination of answers highly unlikely)
- First-click
- Last-click
- A number 1-5
If you have a number 1-5 then match to this table which is a breakdown of a custom position based model (I’ll show more on how this works shortly):
1 = 70-10-20
2 = 45-20-35
3 = Linear
4 = 35-20-45
5 = 20-10-70
These are breaking out the distribution of:
- First click
- Every interaction in the middle
- Last click
That’s it. You have your model and you’re ready to move on to custom rules. Again more on how to put this to use later!
Define Custom Rules
One of the benefits of creating a custom model is the fact that you can define the model to your liking.
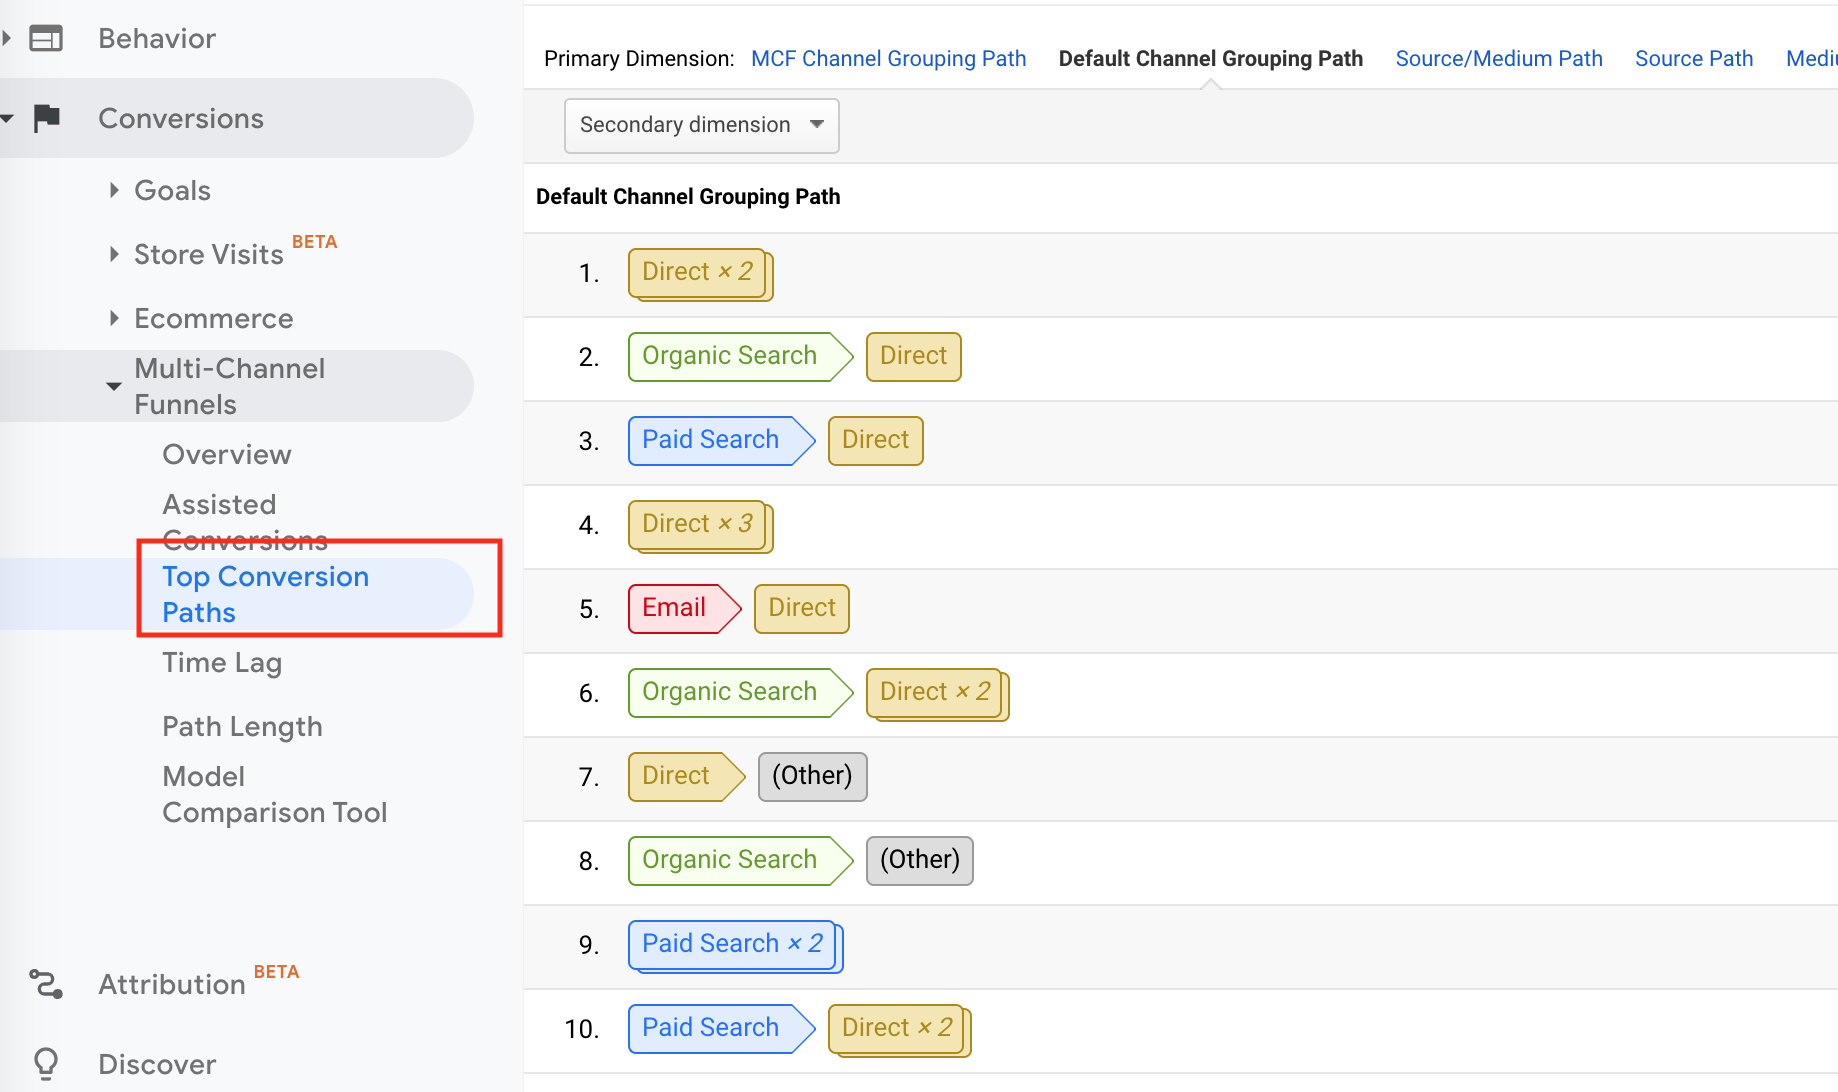
A nifty feature of Google Analytics is that they provide you with a path to purchase for all of your purchases and goals. This allows you to see what your common paths/channels that most often lead to purchases.
Here’s an example where the colored boxes are each their own “path” in the user’s journey to purchase:
And even better is that Google allows you to manipulate credit (e.g. the $$ value of the purchase) provided to your channels based on your selected attribution model.
Creating custom credit “rules” for your attribution model can be overwhelming the first time using it – so don’t sweat it if you are really confused!
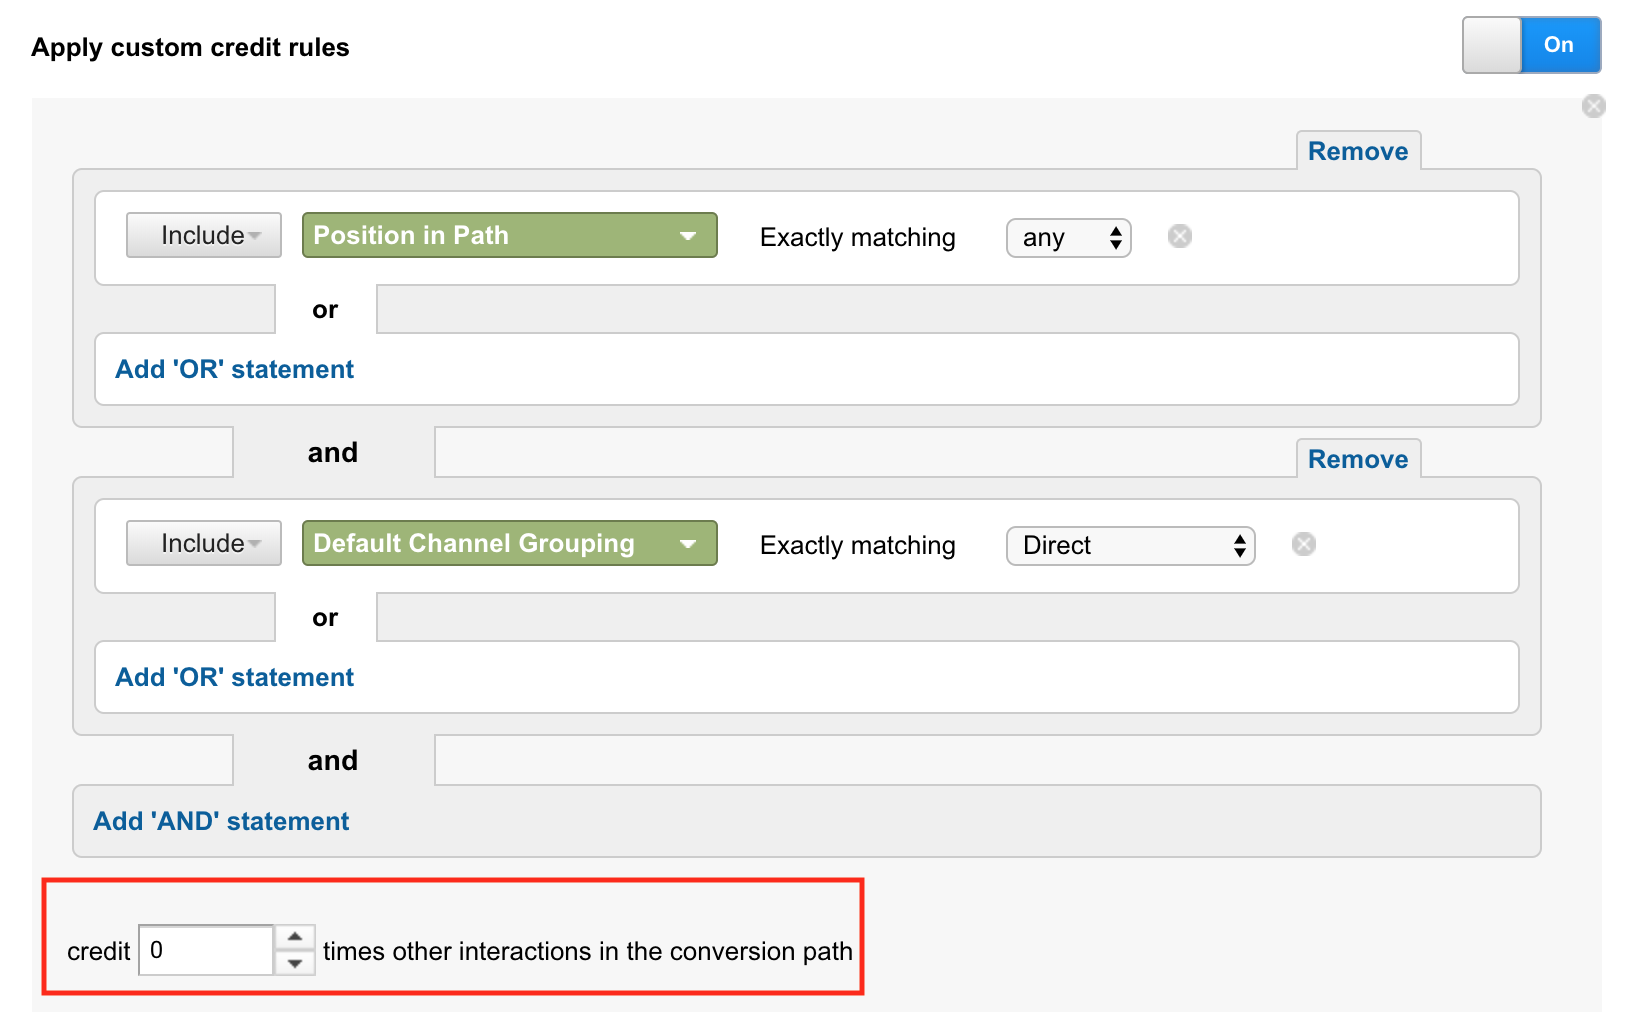
The majority of the time you are creating a custom rule with two step logic like:
- Include Position of Path exactly matching “any”
- AND
- Include Default Channel Grouping exactly matching “direct”
- and then you apply your credit rule.
So if you have “0” as the credit rule and you have a path to purchase of: paid search > email > social > direct, then the distribution that would normally go to direct would be zeroed out and redistributed to the other channels.
Here’s what that looks like:
Here are some common examples of rules we like to implement for any path in purchase path:
- If channel of direct is in any path to purchase then give it 0 credit.
- If search query contains any terms matching regex: coupon|discount|promo|deal then apply 0 credit
- If user bounced on first visit then give 0 credit
- If campaign name contains “abandoned cart” and the position in path is “first” then apply 0 credit
- If any search interaction where brand name is contained in the search query then apply 0 credit
There are so many ways to manipulate this to change how your conversions are attributed!
Build a list of ideas that you want to add to your own rules and continue on to the next step.
Build Custom Model in Google Analytics
Inside of Google Analytics, navigate to Conversions > Multi-Channel Funnels > Model Comparison Tool.
Then click “Select Model” and click the create custom model link as shown in the screenshot below.
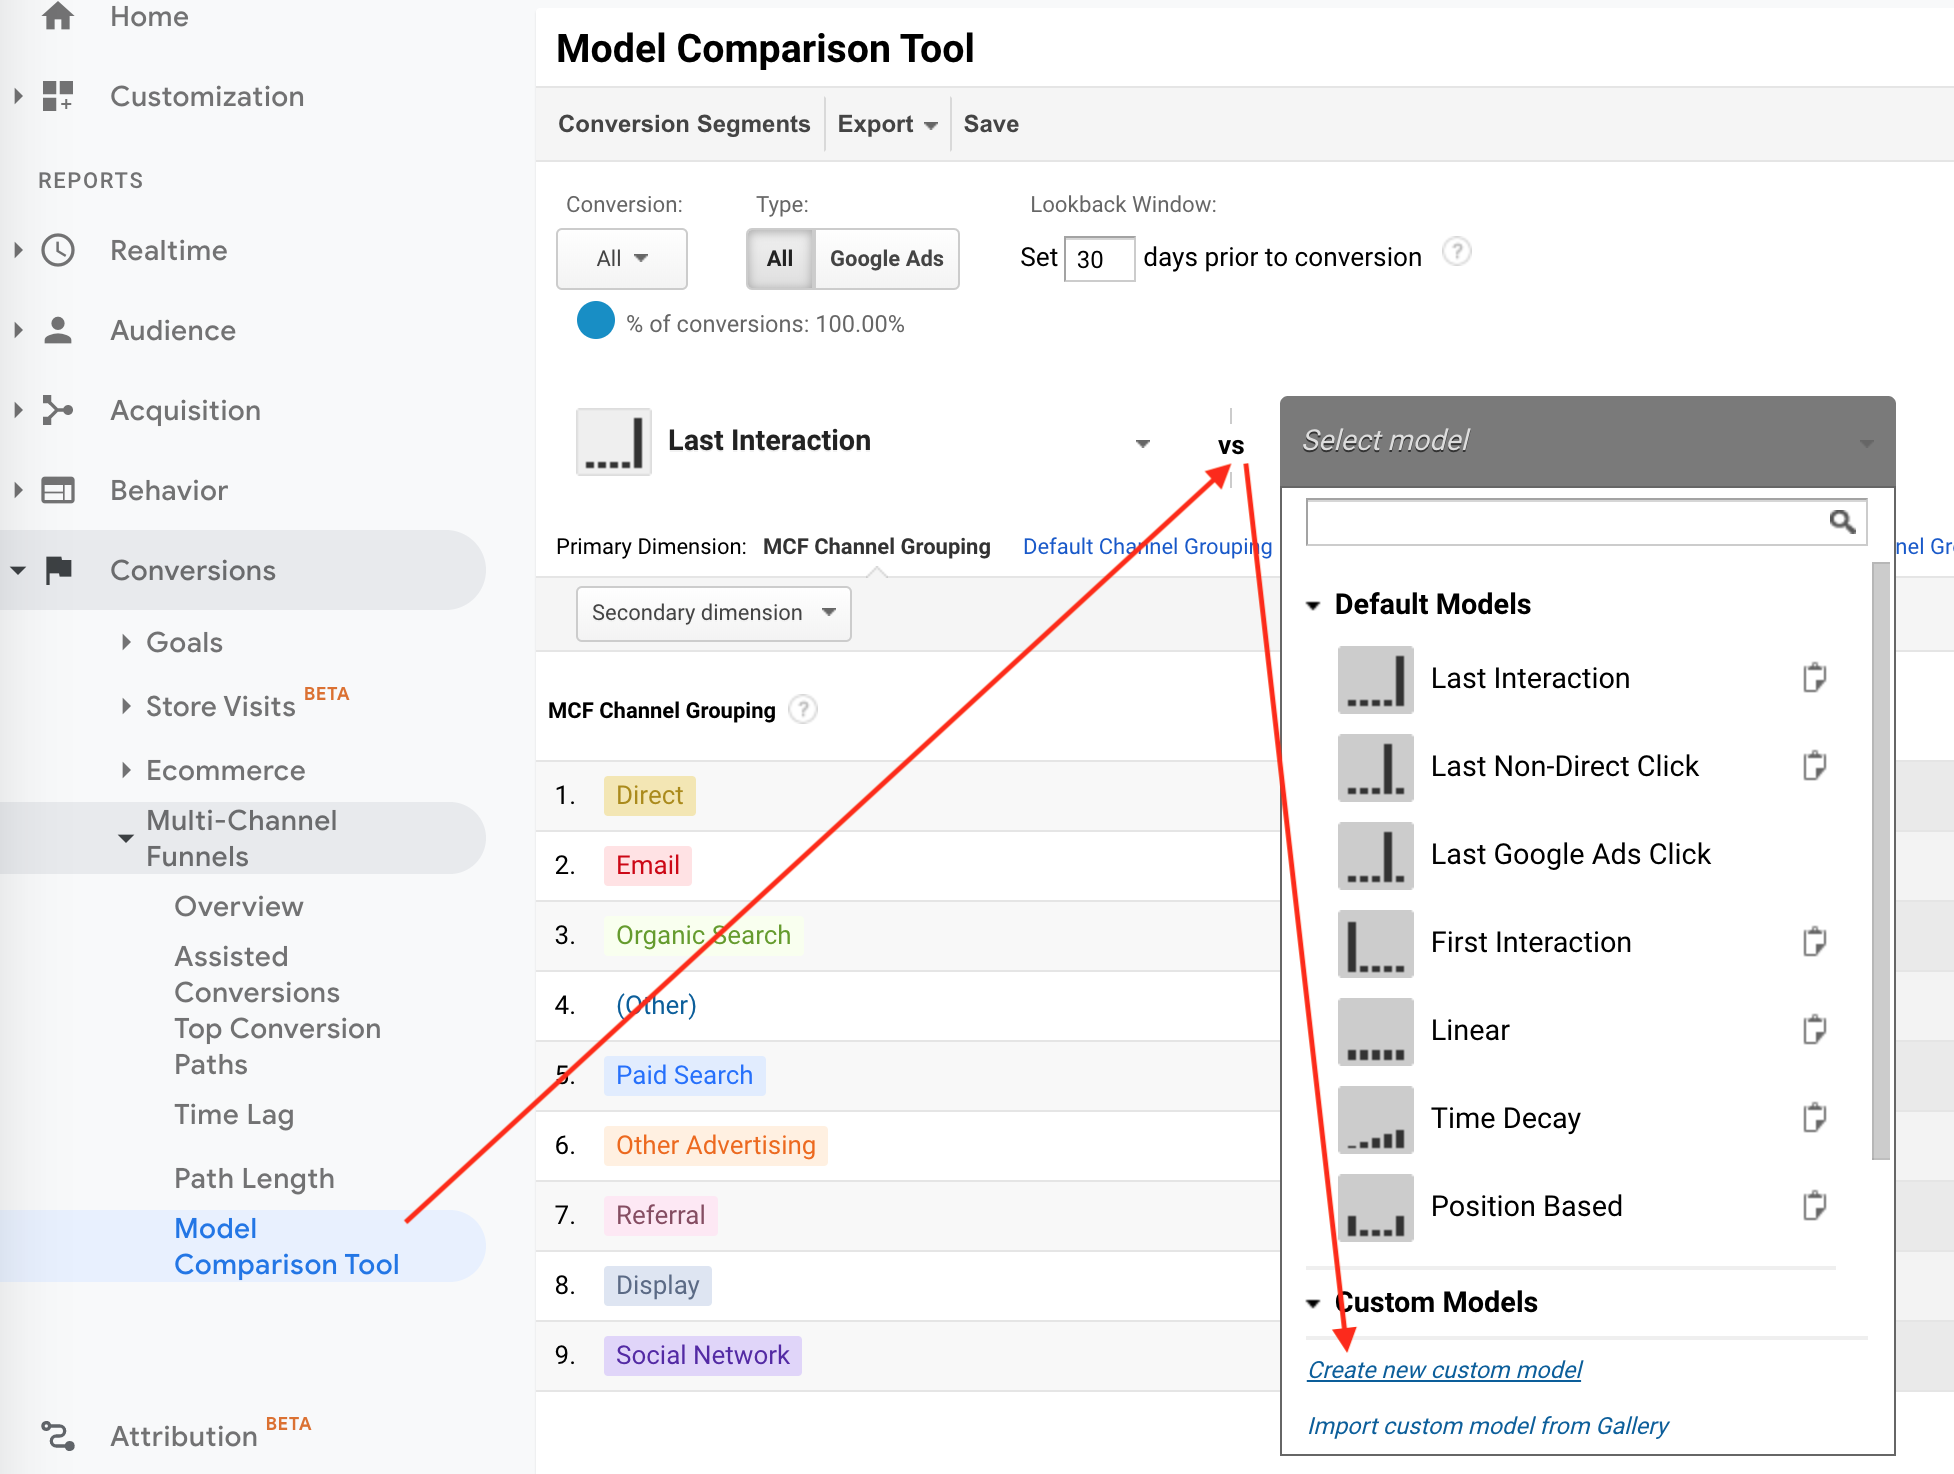
From here you will be prompted with this custom model builder:
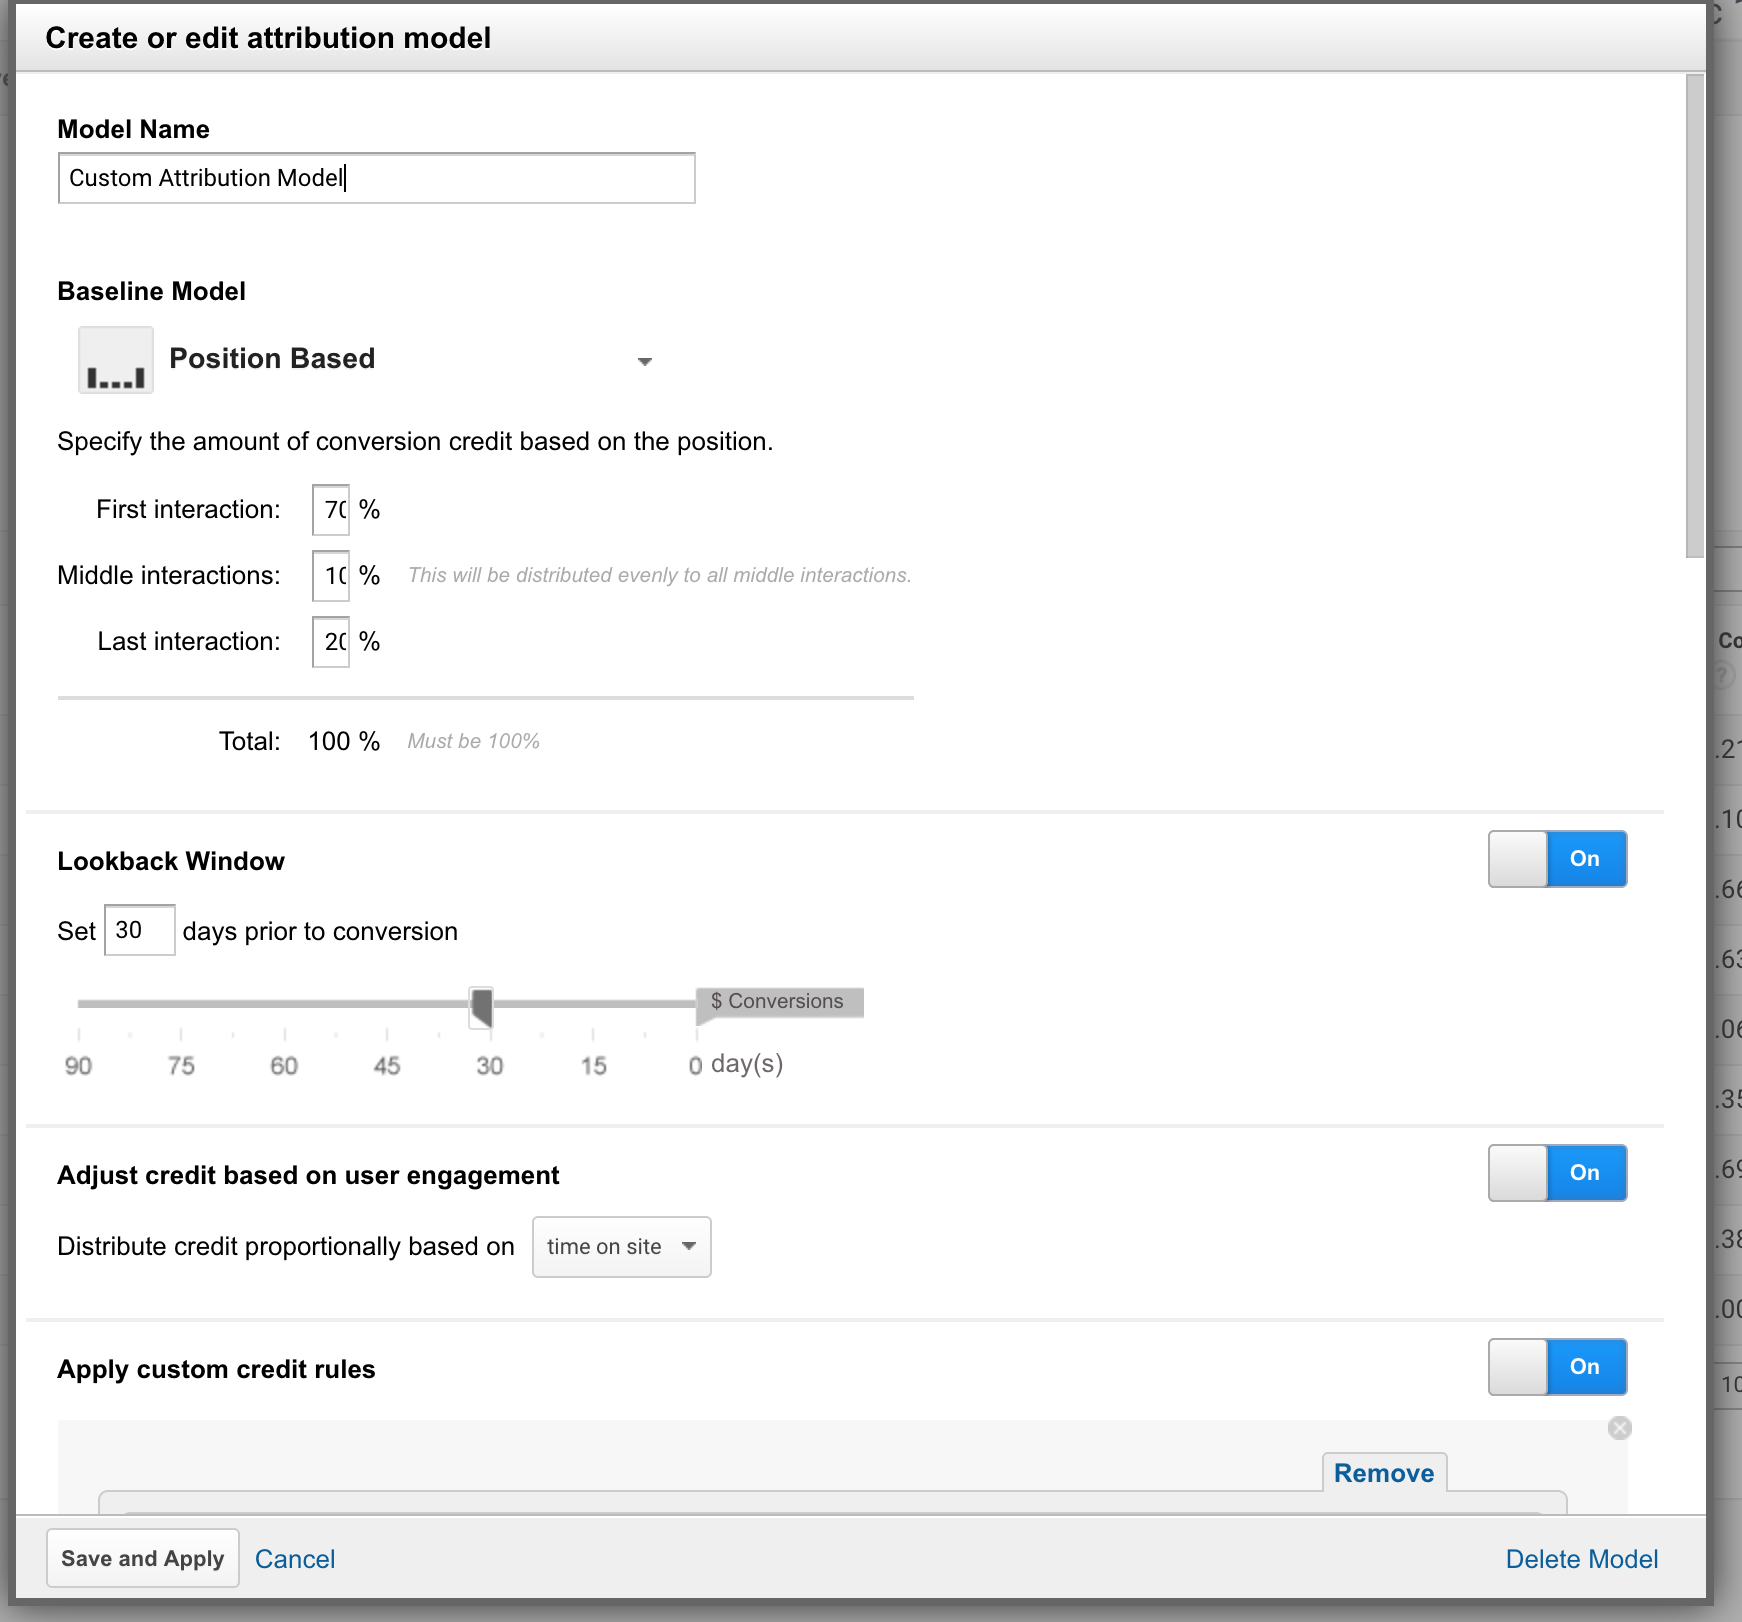
Take the output of your Base Model selection and begin building yours!
If you had a number 1 in your output of the questionnaire then select “Positional” and enter in your custom %’s as shown in the image above:
- 70%
- 10%
- 20%
Which matches our model: High Growth | Brand | Mostly Prospecting | Revenue Growth
Now take your answer to # 7 and enter your lookback window.
Want to adjust credit based on time on site or page depth (e.g. give more credit for visits that are more engaged)? Enable that toggle!
Then you’ll move on to your custom credit rules I just went through on the previous step.
Once you add all of your rules in here and click save – you have your own custom model to put to use!
Keep in mind – you can also come back and edit/adjust these settings. They are not final.
Analyze!
Now I’ll show you to to put this model to use!
If you’re like most of the world, you spend a lot of time reviewing your source/medium (or channel) report in GA like this:
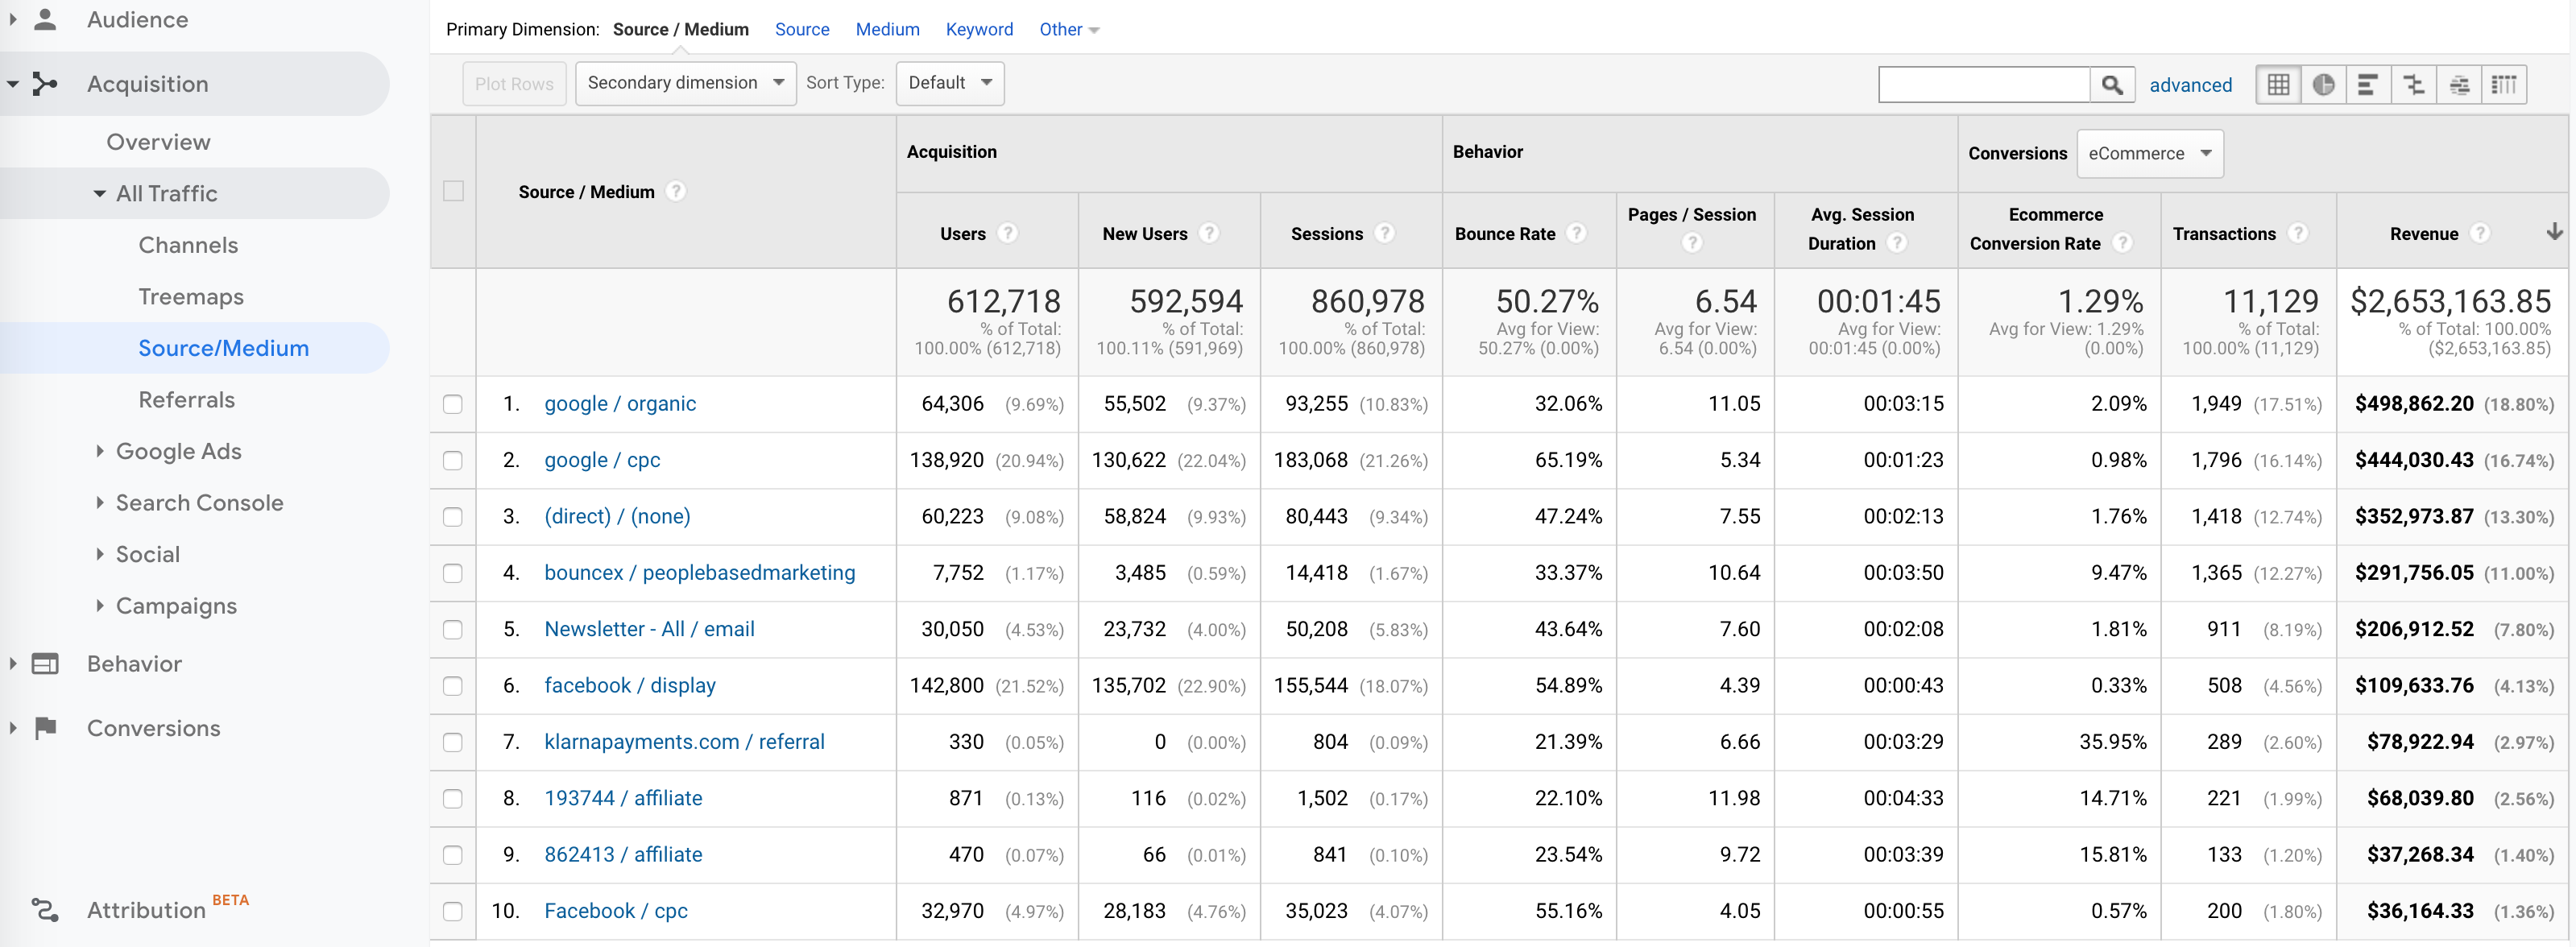
It provides a nice at a glance report at how your channels are performing.
This view reports revenue using the Last Non-Direct Click attribution model.
So if the path to purchase is: Paid Search > Direct, then the revenue will fall under google / cpc (aka Paid Search).
Now let’s compare a custom attribution model where we have true last interaction to a custom model:
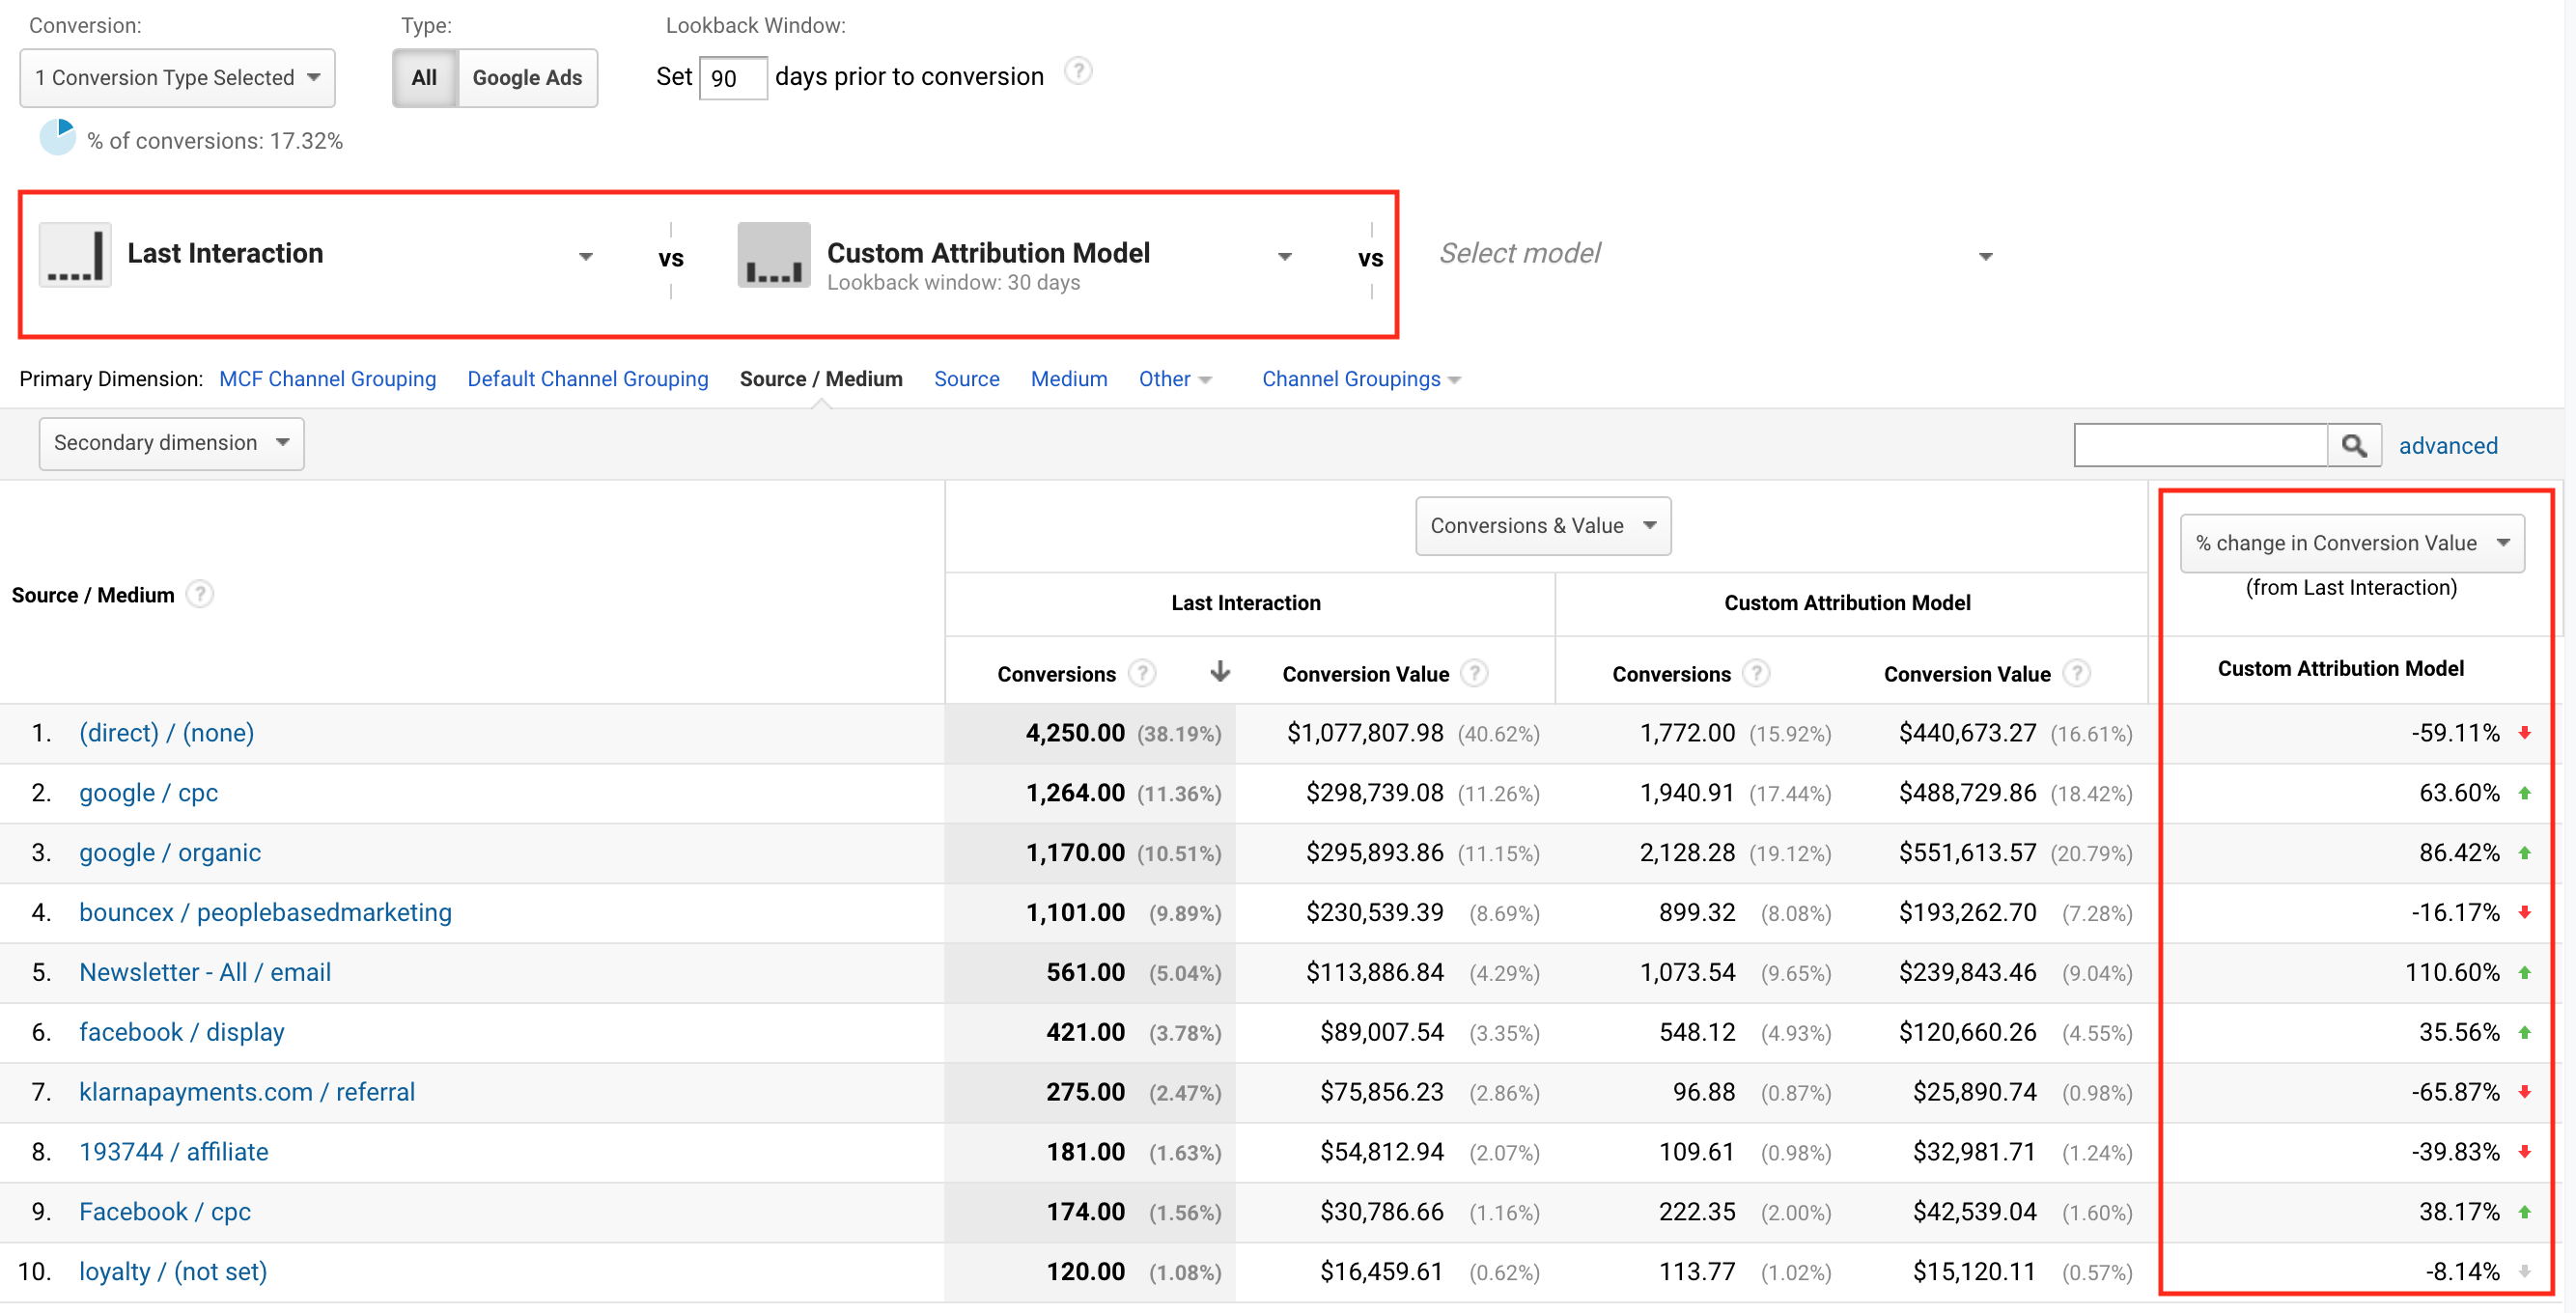
Pay attention to the last column.
This is giving you the % change of where revenue is being redistributed from the “last click” channel to the channels that meet your custom model parameters.
Direct is down almost 60%! Wow! Google is up quite a bit as well as email.
Affiliate is down 40% – maybe not a big surprise if the affiliates are working hard at closing with coupon codes etc.
And now here is a comparison using the source/medium example to the custom model:
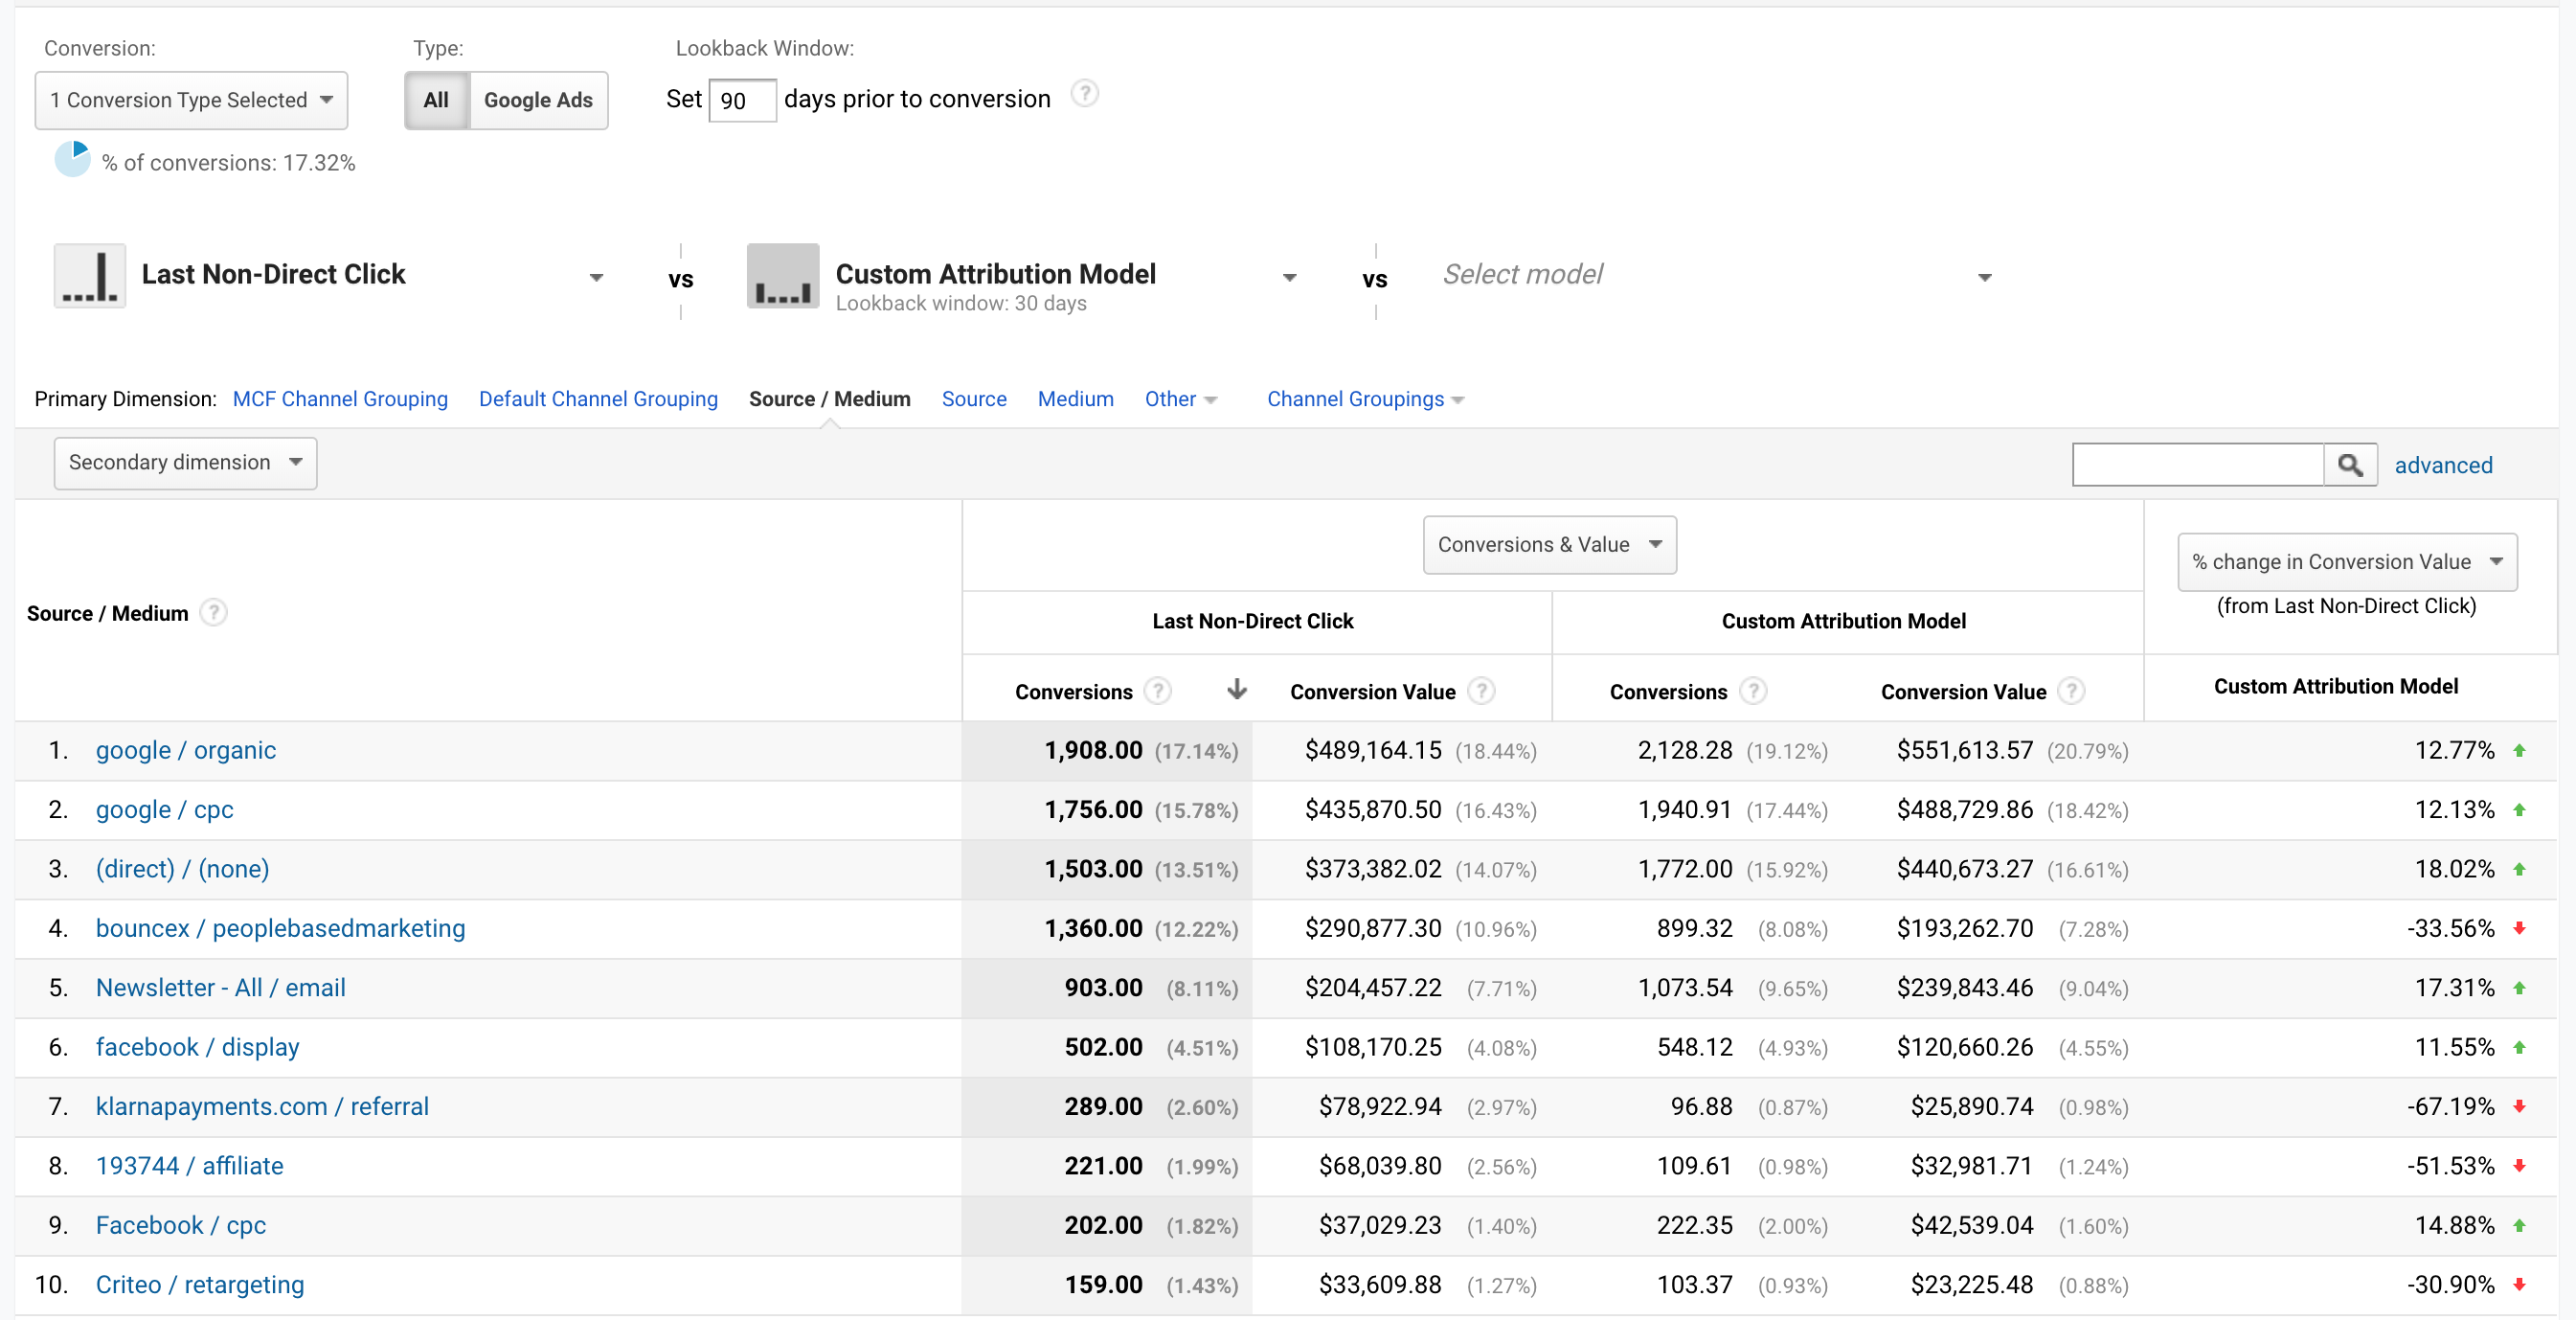
Compare the conversion value differences from this report to the source/medium revenue.
What makes this even more powerful is you can analyze this data by so many other dimensions like: landing page, campaign name, etc.
There’s so much you can do with this data.
It can help drive budgets to the right channel, campaign etc.
Give a try – you might find some surprising insights on how your channels are working for you!

Good day! This is kind of off topic but I need some guidance
from an established blog. Is it tough to set up your own blog?
I’m not very techincal but I can figure things out pretty quick.
I’m thinking about creating my own but I’m not sure where
to start. Do you have any ideas or suggestions? Many thanks