How to View Conversion Rate per Collection Page in GA4
Create a Custom GA4 Funnel to view your Conversion Rate per Collection page. No technical assistance required.
Jerica Krakowski
Technical Product Manager @ Elevar
If you’ve ever had the thought “Which of my collection pages convert better?”, you’ve probably googled your way down a rabbit hole trying to figure out how to view this data in Universal Analytics.
The short answer is: Universal Analytics doesn’t allow you to innately combine pageview & transaction data per collection page. This is because one session can view multiple collection pages. So 1 transaction can be associated to multiple collection page views. If you then tried to add up the total number of transactions associated with your collection page views, it would be larger than the actual number of orders placed!
The good news is, you can easily view conversion rate per collection page in GA4.
(if you have not yet setup GA4, learn how to setup GA4 on Shopify in our related guide)
Part 1: Create a New Funnel Exploration Report
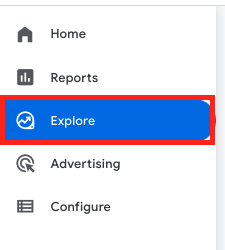
In your GA4 property, navigate to Explore.
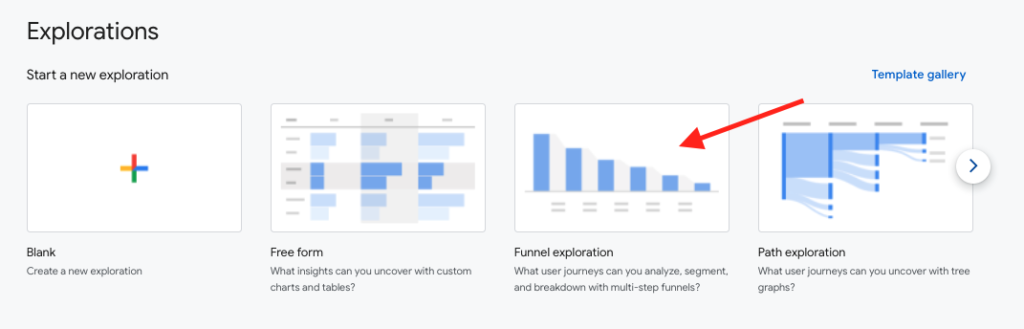
Select Funnel Exploration to create a new funnel report.
Part 2: Customize Your Funnel Steps
Under Tab Settings > Select the Pencil Icon next to the Steps section.
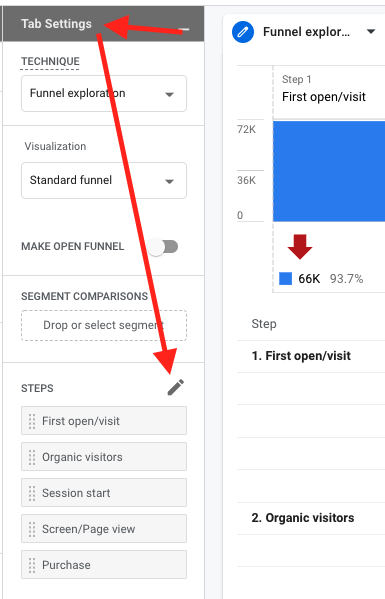
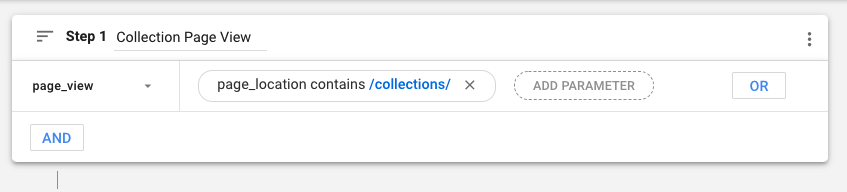
Customize Step 1 to map to a pageview that occurs on a collection page. See my customizations below:
Remove steps 2-4. You should be left with just the Collection Page View Step & the Purchase Step.
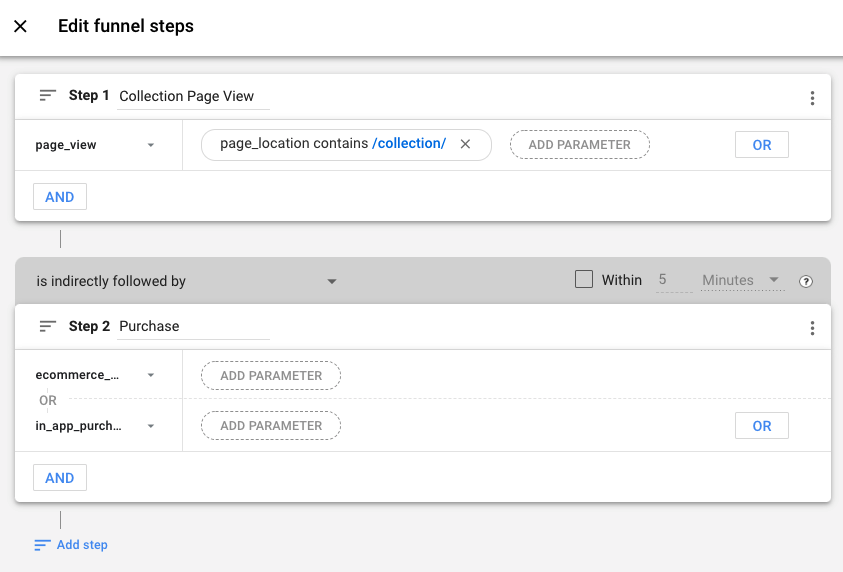
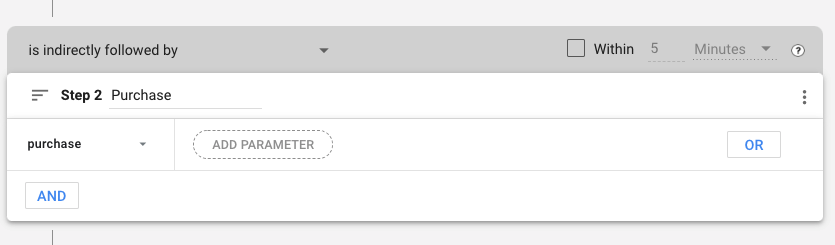
Customize the Purchase Step so that it maps to your GA4 Purchase Event. For example, Elevar’s Pre-Built GA4 tags use the event titled “purchase” for the purchase event. See my customizations below:
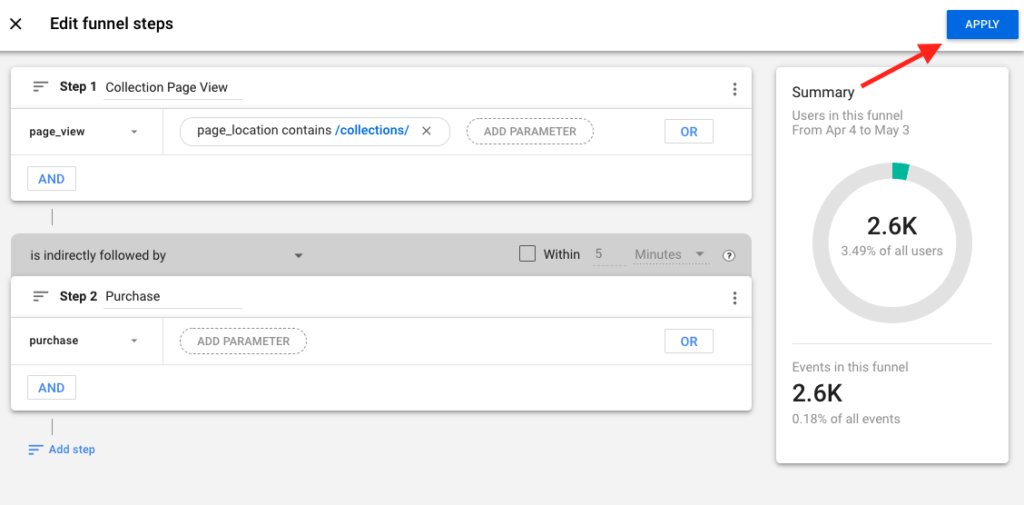
Select Apply.
Part 3: Customize the Breakdown
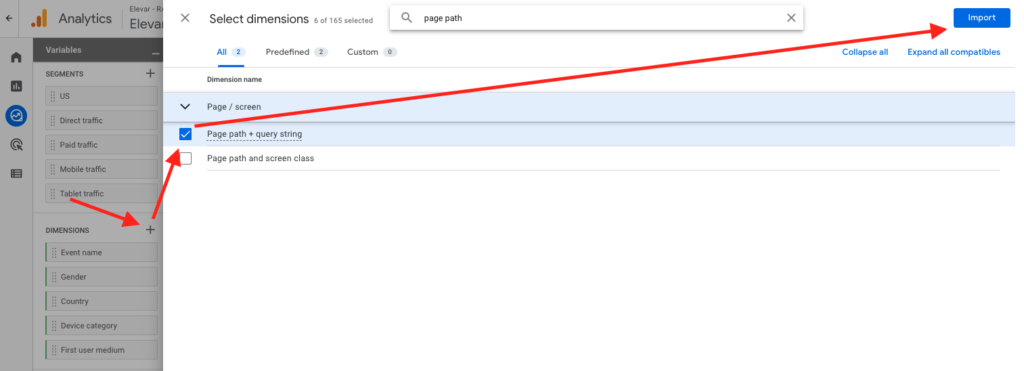
Add Page path + query string as a Dimension.
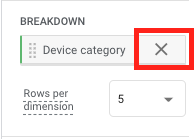
Remove Device category from the Breakdown section.
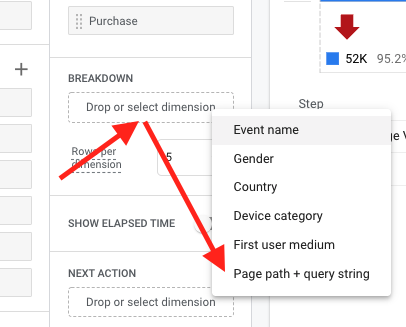
Add Page path + query string to the Breakdown section.
Part 4: Rename Your Report & Analyze the Data
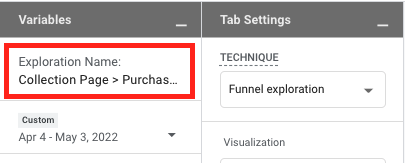
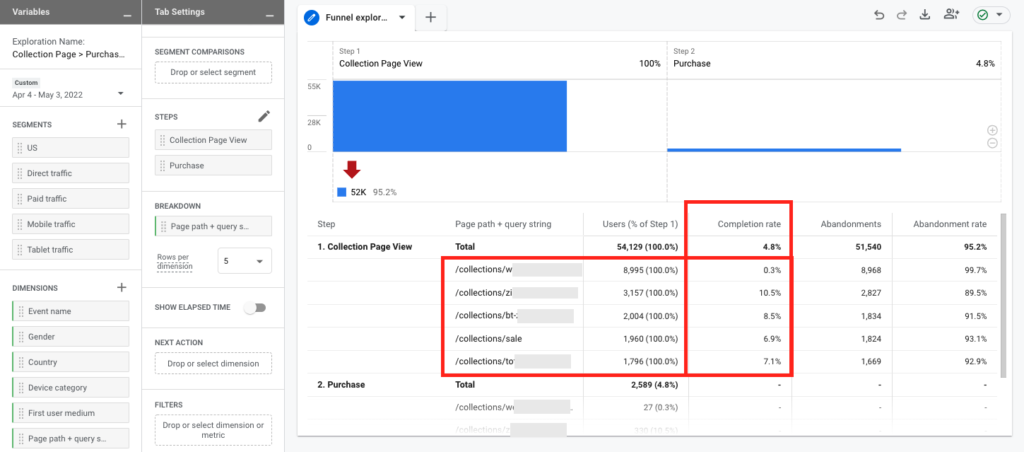
Rename your report Collection Page > Purchase Funnel
You’ll now see a Completion Rate column broken out by collection page URL. This completion rate tells you: of the users who viewed X collection page, what percentage ended up making a purchase. AKA your conversion rate per collection page!
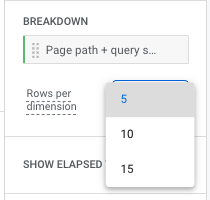
To see more than 5 Collection Page URLs, update the Rows per Dimension in the Breakdown section to 10 or 15.
Don’t have a GA4 account yet? Here’s How To Launch Google Analytics 4 (GA4) On Shopify in Minutes!

Leave a Reply