Do Out of Stock Product Views Hurt Conversion Rate on Shopify Stores?
If users view products that are out of stock on your website – do they exit or end up purchasing something else?
Amanda Johnson
A common question from many of our PRO customers:
“Do you know how many users are viewing out of stock products (or variants) on the site?”
The follow up is usually around conversion rate:
“Did they still convert during that session or are they exiting?“
Levaring Elevar’s data layer…
+ one custom GA event tag
+ updating your existing product detail view tag
You can start tracking your own inventory performance to answer both questions!
How To Measure Conversion Rate for Out of Stock Views
This report will show you the conversion rate for users who view a product (or variant) that is out of stock during their session.
To create this report:
- Import this Pre-Built Container from your Elevar dashboard
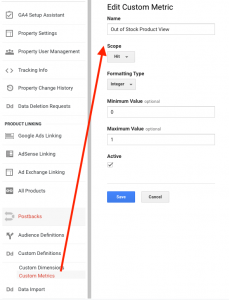
- Add a custom metric to your GA property (see image below)
- Add the custom metric to the product detail view tag and out of stock tag in GTM tag you just imported (see image below)
- Create custom report in GA to track performance – click to add this report to GA
Here’s what the end result looks like:
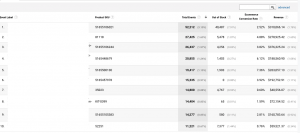
In this report you have the following:
- the event label is the page URL
- product SKU
- total events = total pageviews for this product
- # of times a product or variant was viewed that was out of stock
- conversion rate and revenue for sessions that viewed these out of stock products
It’s important to note this is *NOT* the conversion rate for these products.
This is the conversion rate for the entire session (i.e. did they view an out of stock product and then convert on something else?)
What to do with this type of report?
- Should low converting products that have high # of out of stock views be de-emphasized across the website?
- Are there product views that have a surprisingly high conversion rate that should be promoted/featured more?
There are multiple insights you can extract from this type of report for your own merchandising!
Here is the custom metric setup on your Universal Analytics property:
If you already have our Product Detail View tag in your GTM container then you only have to make one change on the tag.
Just add the custom metric in the advanced settings shown here:
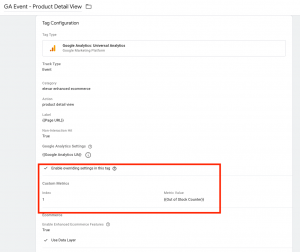
If you aren’t using our product detail view tag then the pre-built container you import above has another standalone tag that will push an event to GA that tracks out of stock product views as well.
What else can you do with out of stock CRO reporting?
One example:
You can pull this data into Data Studio to blend with your real on hand product inventory to get this type of report:
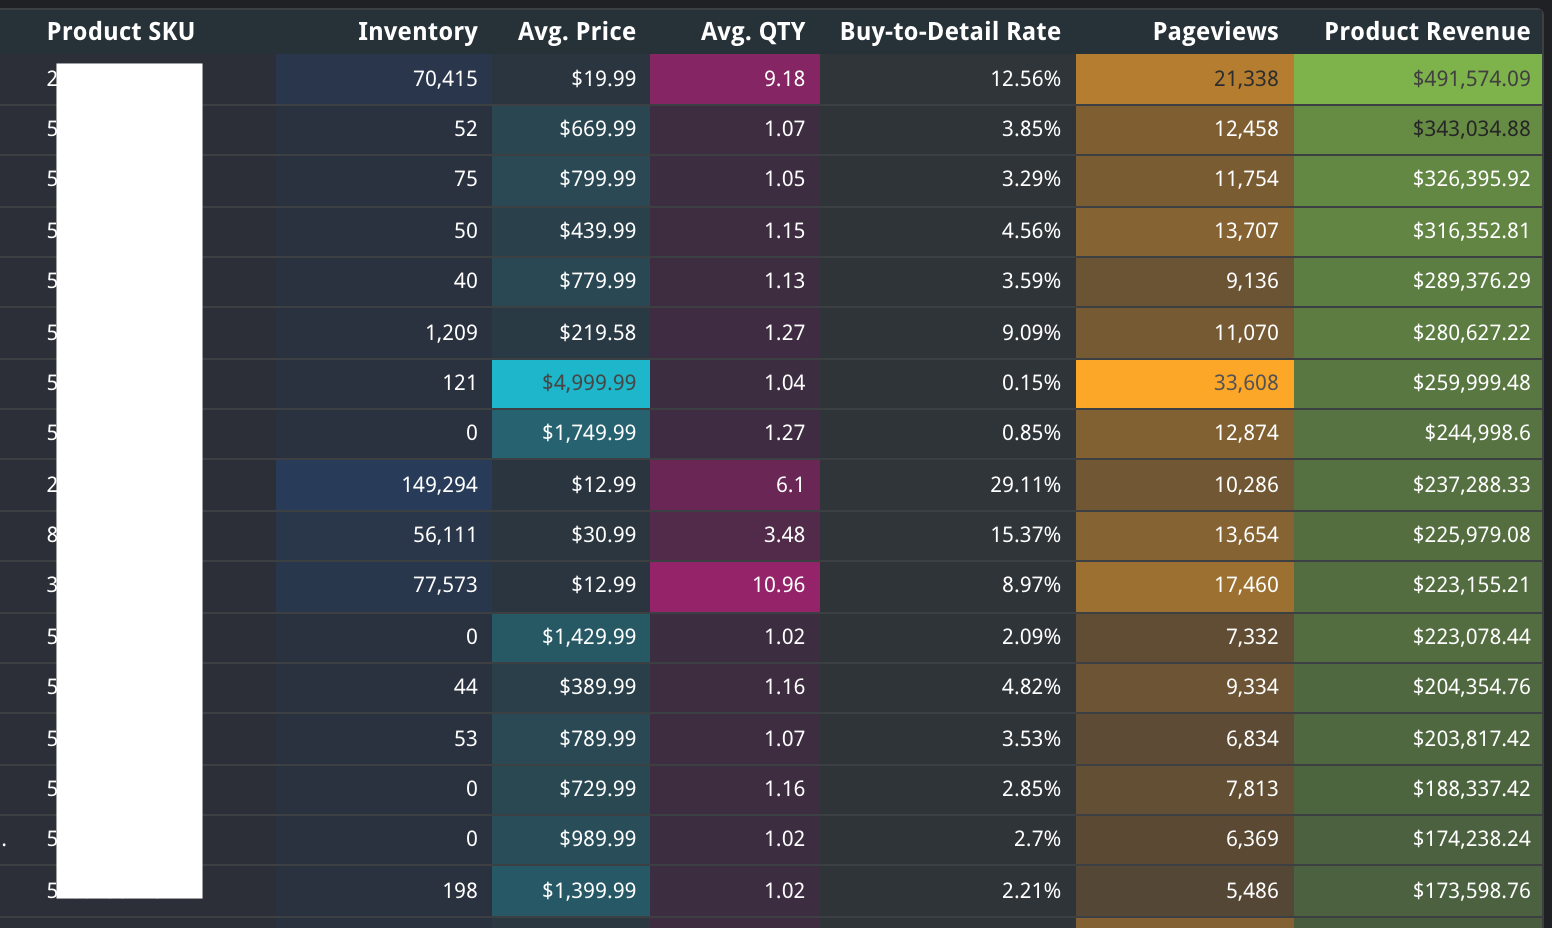
In this report above we can compare traffic volume (pageviews) to stock on hand and shift strategies if needed.
You might be wondering how to do this?
There are multiple Google Sheets apps on the Shopify app store that allow you export your inventory into a Google Sheet that then acts as a data source used in Data Studio.
Set it and forget it!
There is so much you can do with the data you’re already collecting on your website.
Sometimes it is best to start building a list of questions you are trying to answer…
…and then get creative (or ask us!) how to leverage your GTM tags to do the heavy lifting for you.

I want to be able to add the report and I am not able. This message appears: “Sorry, this custom report cannot be imported in the selected view. Please try choosing another view.” Do you know why?