eCommerce Site Speed Optimization: What I Learned
It can be slow, painful, and frustrating — that is, if not properly managed.

Brad Redding
Brad Redding is the Founder & CEO of Elevar. Specializing in analytics, tracking, GTM, and conversion optimization.
You’ve heard the quote: “For every one second it takes for your website to load, your conversion rate goes down by 10%.” That’s costly if your site speed is 10+ seconds.
For eCommerce websites especially, I see people unfairly pinning sluggish load times on either the site’s platform (e.g., Magento is one blamed often) or the development team (“they’re incompetent”).
But in most cases those aren’t the primary issues at all. It boils down to poor business management of the website.
I’ve personally been one to let performance monitoring spiral out of control — and then had to scramble when the damage was already done.
To amplify the risk even further for slow websites, Google states that site speed is used as a search ranking factor. And most recently, Google stated it would use mobile site speed for mobile search ranking factors.
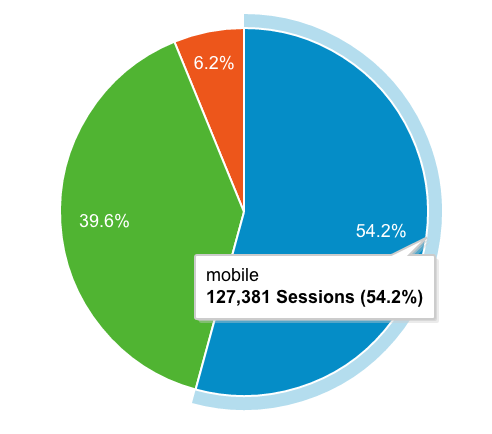
Considering your mobile traffic is growing by the day, site speed needs to be at the top of your ongoing website optimization checklist.
So how exactly do you speed things up?
To help, I’ve broken down my experiences and tips into three areas:
- What causes slow websites?
- How to break down and diagnose potential performance issues
- My “big 4” buckets for page speed optimization
What causes slow websites?
I won’t repeat what you already have at your disposal from free performance analysis tools, such as Google PageSpeed Insights, Pingdom, WebPageTest, and so on. Rather, I’ll outline what I’ve learned through my own experiences.
First, a word of caution: Those free tools are great for quick insights but aren’t going to be the magic bullet that will solve all of your issues.
Here are some of the common causes of slow websites to watch out for:
- When the team who executes the photography/edits of products and content for the website doesn’t have a documented process for images. They should be cropping images to the proper aspect ratio and compressing to a quality score that results in an image size no more than 100-200kb per image. A fractionally higher quality image won’t convert more than a slow page.
- When a process for controlling the total number of assets loading on a single page doesn’t exist. Thus, a HIPPO (highest paid person’s opinion) home page is created that takes 5 seconds to scroll down due to 100s of images, banners, content, etc., — all of which aren’t optimized.
- When hosting providers are not proactively managed by skilled professionals. If you’re not on a SaaS platform, such as Demandware or Shopify, then it’s up to you to ensure your hosting environment is utilizing the latest technology and configurations for performance optimization (and is load tested!). When do you talk about your hosting? When things are going wrong! Don’t let a project manager solely manage hosting.
- When your code quality is poor. Ensure your in-house development team or agency managing your codebase utilizes development performance debugging tools (like Blackfire, as well as New Relic) to monitor and debug performance issues on your staging and production websites.
- When there’s no server-side caching (e.g., Redis, Varnish, phpfm) for static content rendering. If 90% of your site is static then that content should be cached and a user should not have to hit your server to load the static content.
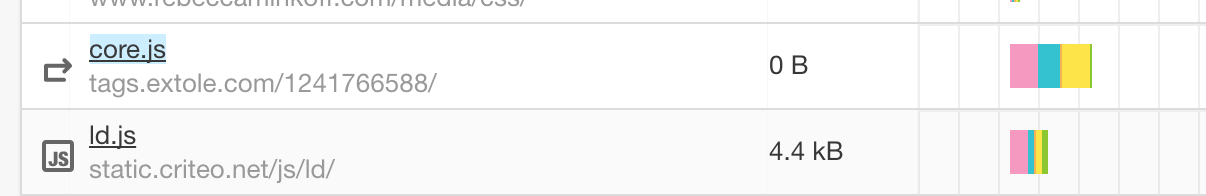
- When you have a 3rd party script graveyard! Remember that marketing script you added to the site last year to help drive traffic and dollars? If you aren’t using it anymore, get rid of it. Grab a URL on your site and drop it into Pingdom to analyze the scripts loading — if any are 404’ing or you aren’t sure what they are being used for then bubble up to your marketing or development team for review. In the example below, Criteo is a retargeting platform, and Extole is a referral service that you can get by taking the domain and Googling it.
How to diagnose potential performance problems
Ask yourself these four questions when reviewing opportunities for improving site speed:
How large is the page?
If a page is significant in size (measured in Kbs or Mbs) then it’s going to take longer to download. Think about your phone and your data plan … this is data that you are downloading to your browser to display. When you’re downloading a 20MB app it takes a while, right? Same goes here.
How many “things” are trying to load?
Visualize each “thing” loading on your page as a person walking through a door, and everyone is attempting to walk through the door at the same time. The time it takes for 20 people to walk through the door versus 200 is a big difference (likely many seconds!). This same concept can be applied to all the “things” loading on your site — you want to minimize or consolidate the total number of assets loading at a time.
Is the site engineered in a quality manner?
As mentioned above, poor quality code and platform standards mean poor performance. A quick code review through automated profiling tools can help answer this question for you.
Is the site hosted in an environment that is conducive to supporting fast(er) site performance?
Server, platform, and cloud technology continue to advance with a focus on performance. Poor quality or an inadequate infrastructure will have a direct impact on response and processing time and subsequently your page speed performance.
The big four buckets to optimize
Now that we know what causes slow websites and how to start diagnosing issues, let’s dig a bit deeper into tactical to-dos:
Bucket #1: Time to First Byte (TTFB) & Network Latency
This is the period between a user requesting your URL (e.g., entering it in the browser, clicking in from Google, etc.) to the first piece of data (i.e., byte) returned from the server or cache proxy that is hosting your site. You can assume this metric is essentially the responsiveness of the web server.
- Insights to improve your time to first byte:
- Utilize gzip compression in your htaccess file or reduce the overall file size of assets.
- Utilize browser caching via cache-control headers set in your htaccess file.
- Utilize caching tools like Varnish or Magento’s Full Page Cache that will reduce the time it takes until the initial DOM content loads. (read how to optimize Magento’s Full Page Cache)
- Utilize a CDN that can serve all of your static html and assets like Cloudflare, Akamai, InstartLogic, etc.
- Invest in the right hardware with a legitimate hosting provider. An ROI will be easy to prove out by utilizing a legitimate hosting provider with quality hardware. So network for a few extra bucks versus trying to cut costs and go cheap, which could hurt overall performance (or worse, have more downtime outages).
- Utilize redis for cache and session storage.
Be sure to have your max concurrent users and orders placed per hour — and double these — when reviewing your hardware needs with your hosting provider or development teams. Google Analytics and/or New Relic can provide this data for you.
Bucket #2: Application Optimization
This is the processing time of the application you are utilizing for your website (e.g., Magento, Shopify, Demandware, etc.) to execute and display the page requested.
For example, if your product page is loading, then there is CSS and JavaScript that will need to execute in order to properly build your page.
Insights to improve your application performance:
- Ensure that the merging of JavaScript is enabled, which consolidates potentially 10 to 20+ separate JavaScript files into 1 or 2.
- Ensure that the merging of CSS is enabled, which consolidates potentially 10 to 20+ separate CSS files into 1 or 2.
- Minify CSS and JS to reduce the overall size of these files.
- Serve your JS, CSS, and images from a subdomain to allow for asynchronous loading of files (i.e., files can load from multiple subdomains at the same time as your primary domain).
- Most of the time application performance optimization is going to require a developer to profile a page/set of pages to look for bottlenecks in your code. New Relic can help provide insights in pinpointing where the issues are, but you’ll need a team to implement and test.
- Reduce your 404 pages as this taxes your server (a 404 page is actually a server error).
Bucket #3: Database Optimization
Your website likely has one or more web application servers where software, such as PHP, Nginx, or Apache, is installed to run your application as well as a separate database server — where MySQL or Percona is installed to store data.
Most page loads require calls to your database to return data that is used to help build out your page.
For example, when you are utilizing actions like “onsite search,” “add to cart,” “add to wishlist,” “coupon code entry,” or “order placement,” these all require calls to your database.
How do you test your DB performance?
- If your site search has an exact URL (e.g., www.[yoursite].com/search?blue+shirt), try inputting this URL into Pingdom to see what your total page load speed time is.
- Good old testing never fails. Try your “add to cart,” “coupon entry,” or “order placement” functions and see how the performance is. While it’s not a guarantee that [when] they are slow it’s because of DB performance, in many cases this is the first place to start troubleshooting. New Relic can provide exact timing for all database calls (individually or in aggregate).
- Insights to help you improve:
Have a good estimate on the load your database needs to support. - For example do you take 10 to 20 orders a day, 2 to 3 orders per minute, or 100 to 200 orders per minute? There is a big difference between the three and will require different DB sizes and setup from your hosting provider.
- Have a quarterly DB cleansing task built into your roadmap with your development teams. This means cleaning out old log tables, getting rid of unused/expired coupons, archiving sales orders, etc.
- Work with a DBA from your development team or hosting provider to ensure your basic configuration settings for the database are set properly. Sometimes a 30-second configuration change can make or break the performance of a database.
Bucket #4: Asset Optimization
Images, 3rd party scripts, fonts, and pixels are examples of assets that are part of your overall page load.
For example, you might be utilizing custom fonts from Google Fonts or Typeface that require you to install a small snippet of code on your site to change your default site font to this new font.
Other common examples are digital marketing scripts like Google Remarking, Criteo, Adroll, etc., that are installed on your site and pull data after they execute on a page load.
Once again, Pingdom can help you see how long your assets are taking to load.
Insights to improve:
- Use a CDN (as outlined in bucket #1, too!) for serving all of your assets.
- Utilize a tag management tool like Google Tag Manager (here’s a guide on GTM for Shopify) that will help in the organization of your 3rd party scripts and ensuring these load asynchronously. This helps prevent a page from freezing while waiting for another 3rd party script to load.
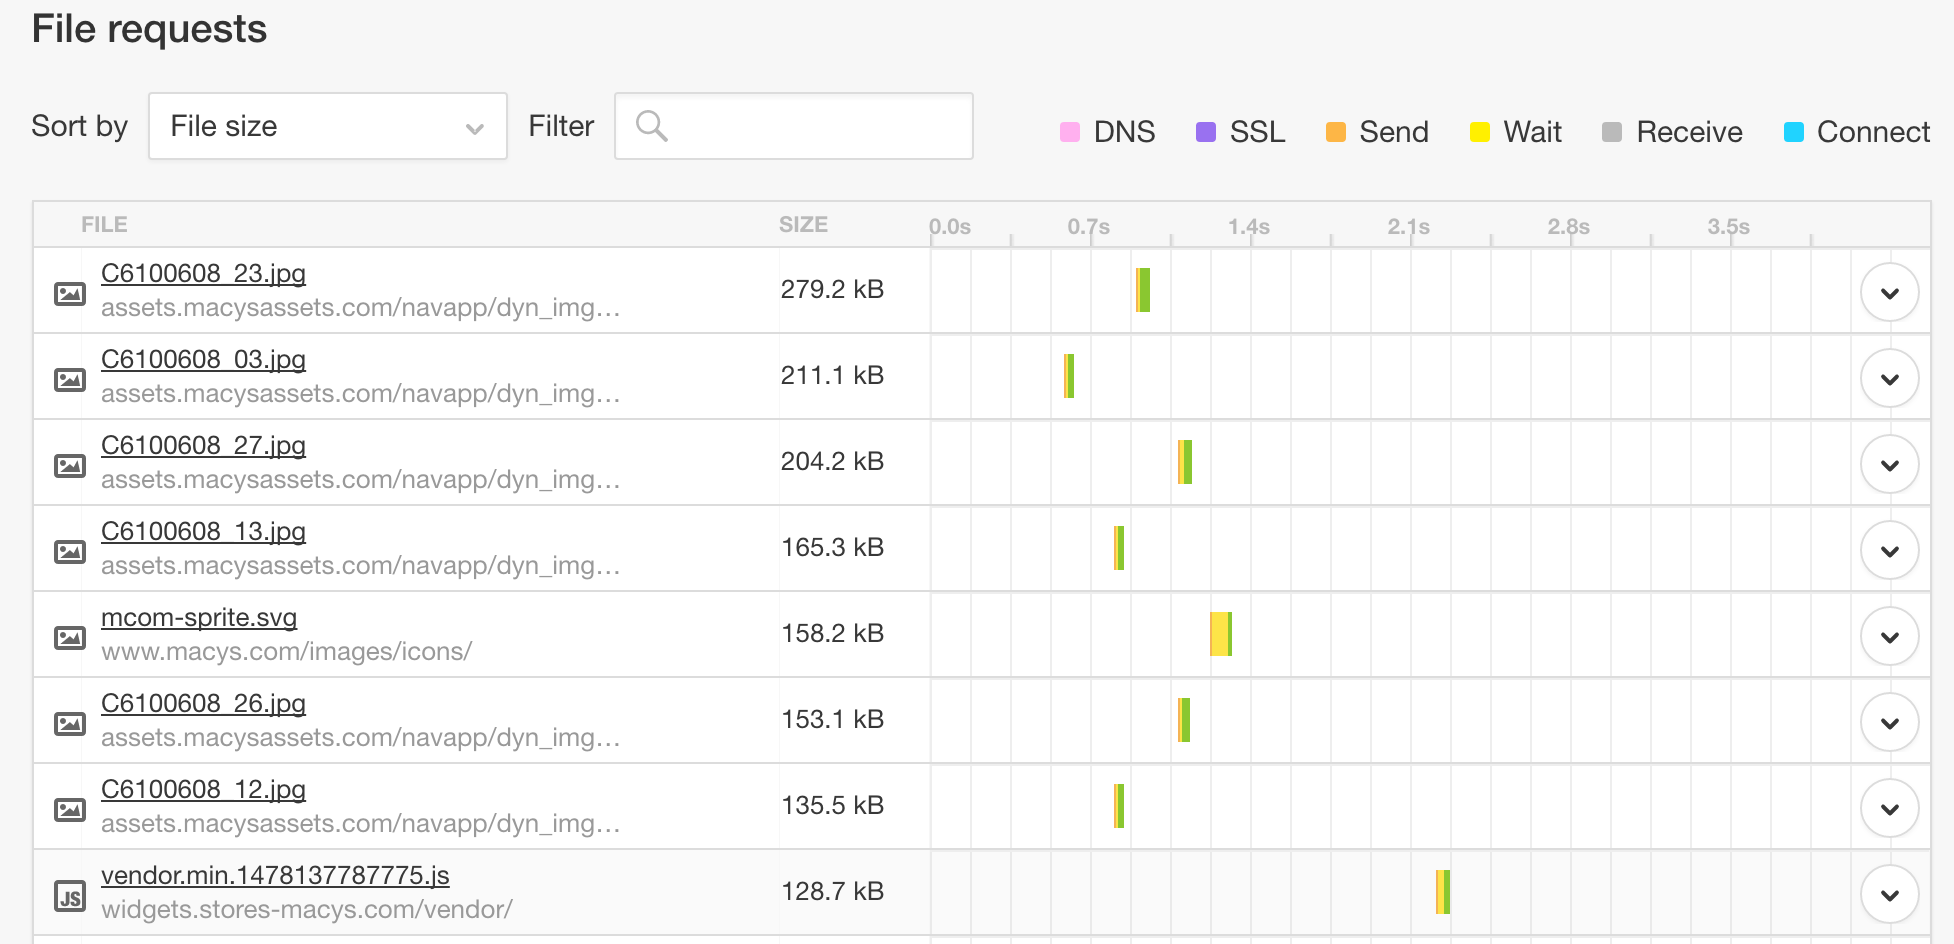
- Compress your CMS and product images before uploading to the site so they are ~100-to-200kb max size. This will help keep the overall size of your page down to a respectable limit (try to aim for < 2MBs for total page size). Ensure your image production team is following the standards you put in place for file size, aspect ratio, and quality (for example, a max size of 200KBs, aspect ratio max of 1,000 x 1,000 if a square image, and quality of 70 to 80).
- Download custom fonts being utilized and store them on your server so you don’t need to use external scripts to load your fonts (you may see this on some sites where the font “flashes” on load).
- Remove old/unused 3rd party scripts from loading on your site.
A recap on tools to help measure site speed performance:
- Pingdom.com — this is a similar service to webpagetest.org.
- Google Pagespeed Insights — you’ll see these insights within your Google Analytics account.
- Google Analytics — utilize the page speed report to provide aggregate page load reports as well as page-by-page DOM load times.
- New Relic — I like to call New Relic the “Google Analytics for site performance.” It’s a powerful tool that will provide a ton of data and reports on where time is being invested in loading a page or set of pages. It’s the #1 tool to utilize for true performance debugging.
- ySlow — the grandfather of page load grading. This tool will run a scan of your page and provide insights on areas that need improvement (e.g., merging JS files, compressing media, and more).
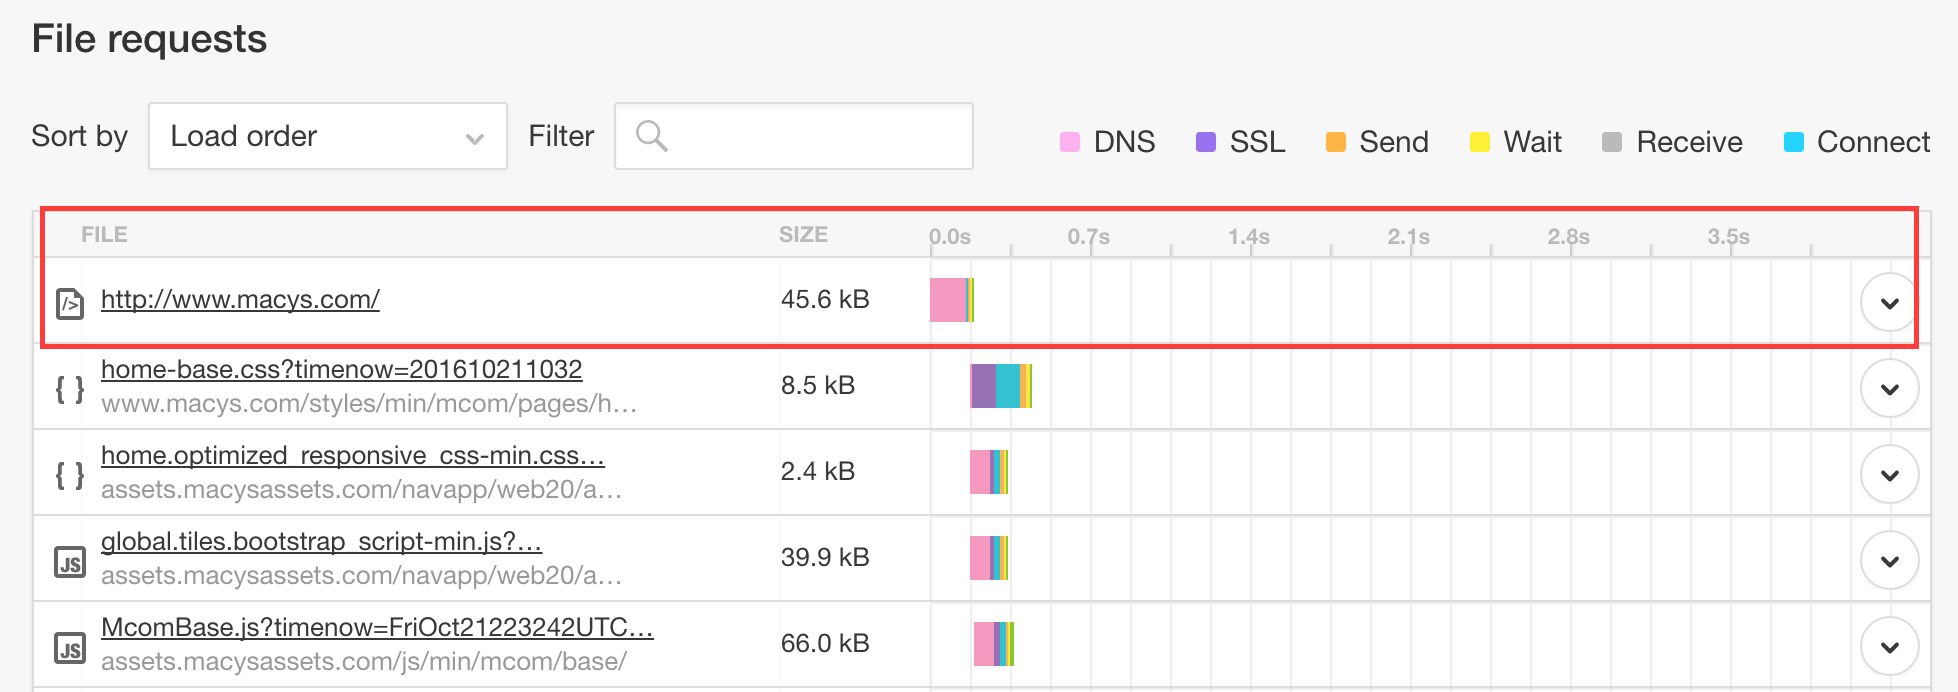
- Webpagetest.org — this provides a waterfall report of every asset that loads on your site, when it starts, and when it’s done loading. It will also provide some common suggestions for improvement for problem areas.
- GTmetrix — similar to webpagetest.org with the additional feature of allowing you to create a few accounts to run regular scans of a page to see how it trends over time.
Great post Brad! definitely a lot of take aways here for anyone even as a refresher. Product images can be beasts!
Thank you, I appreciate the feedback!
Brad, this is a GOLD MINE! This one is going to be saved for sure to my list of checkups. Thanks for going into the detailed nitty gritty. I can always rely on you to get down to it like this and that’s what we need! Thanks!
Thank you for this wonderful article. I took on board the advice and applied some of the tips. Excellent work!
Hey, I enjoyed reading the guide. Being a digital marketer I can relate to everything you mentioned above. Many thanks for sharing the same.