Automate Sitewide Error Tracking with GTM Javascript Trigger
Find conversion killers with built-in error tracking events to help monitor your site.
Browsers, devices, and operating systems, OH MY!
Face it – it’s nearly impossible to thoroughly test your website or incremental feature releases across the infinite # of browser + browser versions + operating system versions + device types.
Once you add external scripts from 3rd party services for marketing, security crawling, and features into the mix then you’re really doomed. In my experience, many of these services don’t support legitimate sandbox environments so you’re left to “do it live” (shout out to one of my favorite videos of all time – Bill O’Reilly’s “we’ll do it live”!).
Fast forward 30 days and you get a bug report of something not working on some unknown browser & OS combination that you can’t replicate.
Enter automated Javascript error tracking via Google Tag Manager.
While this isn’t the magic bullet for automating QA it is a nice feature to help monitor your site for significant revenue impacting issues.
Setup Your Javascript Error Tracking Tag
This takes less than 5 minutes, promise.
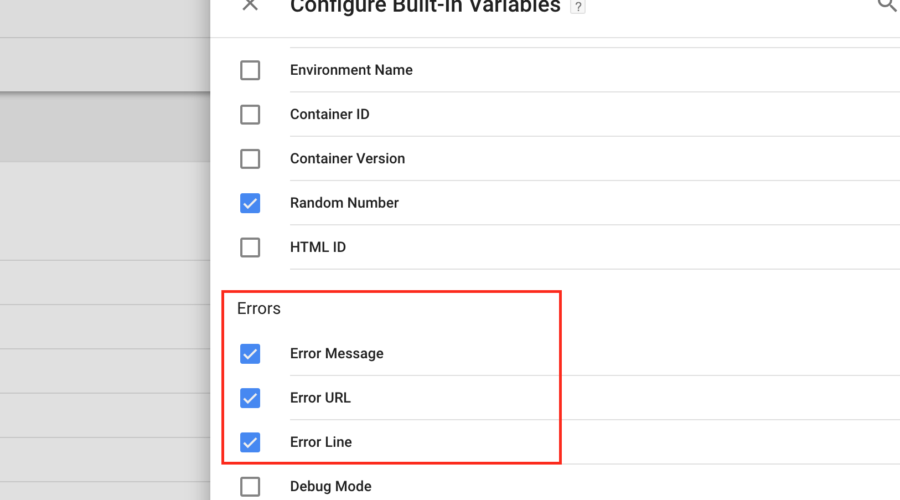
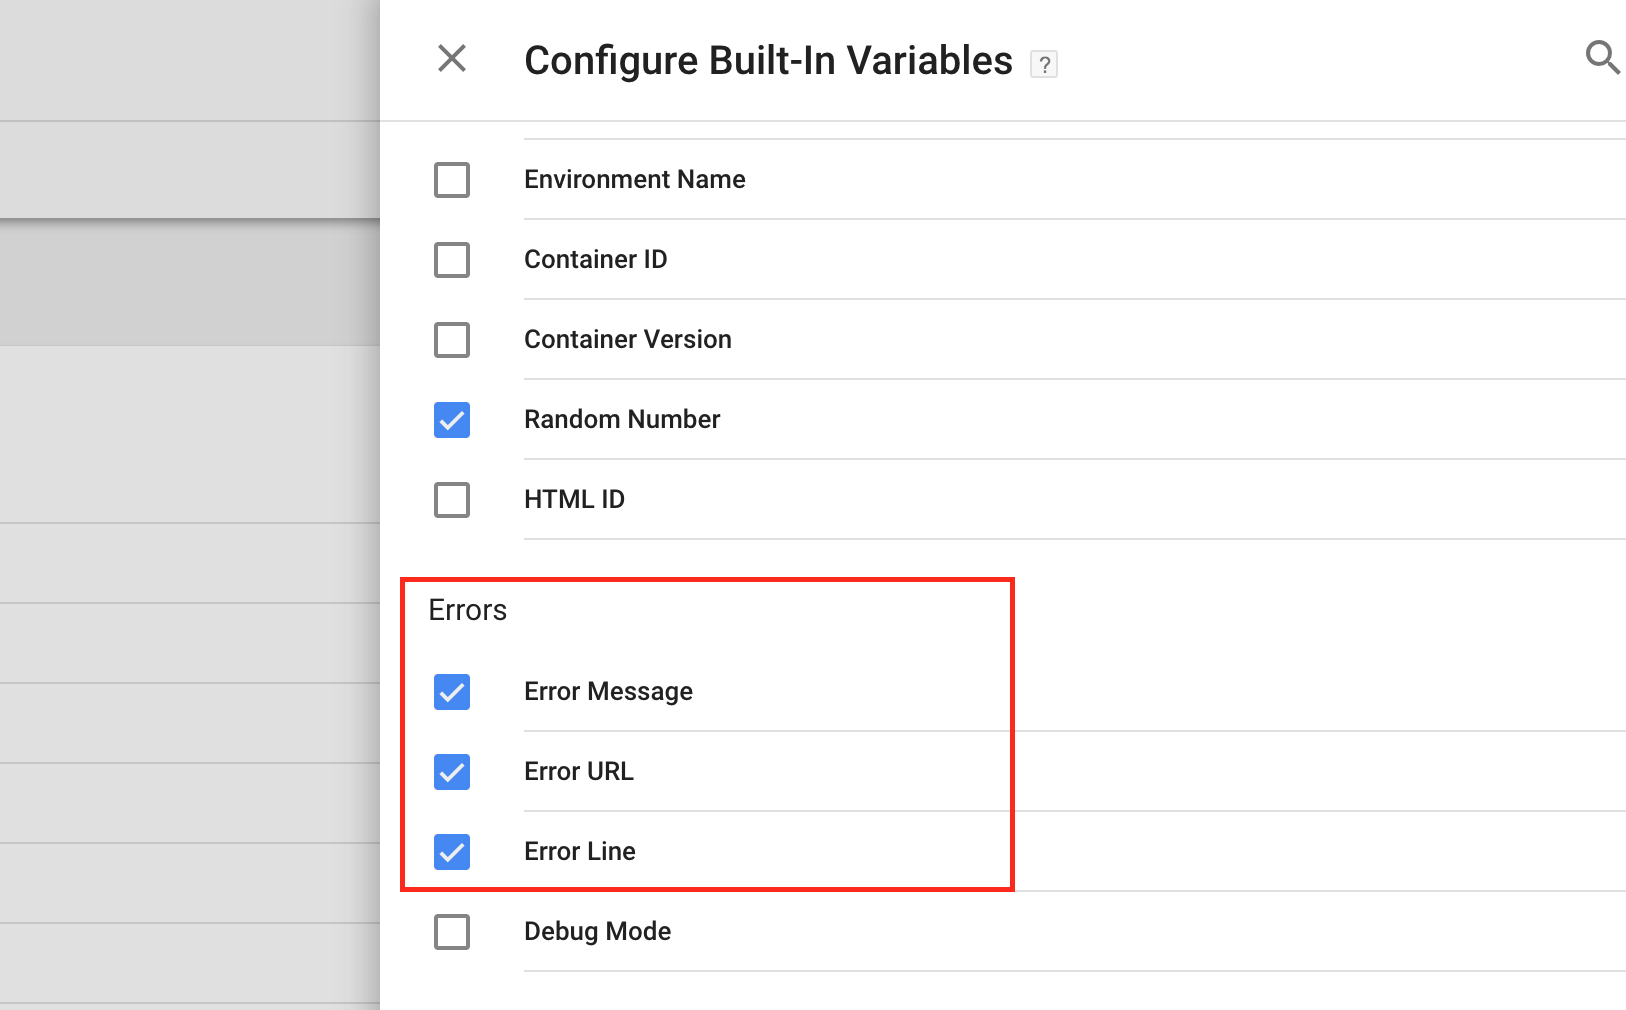
Step 1: Enable Built-In error variables
GTM > Workspace > Variables > Built-In Variables:
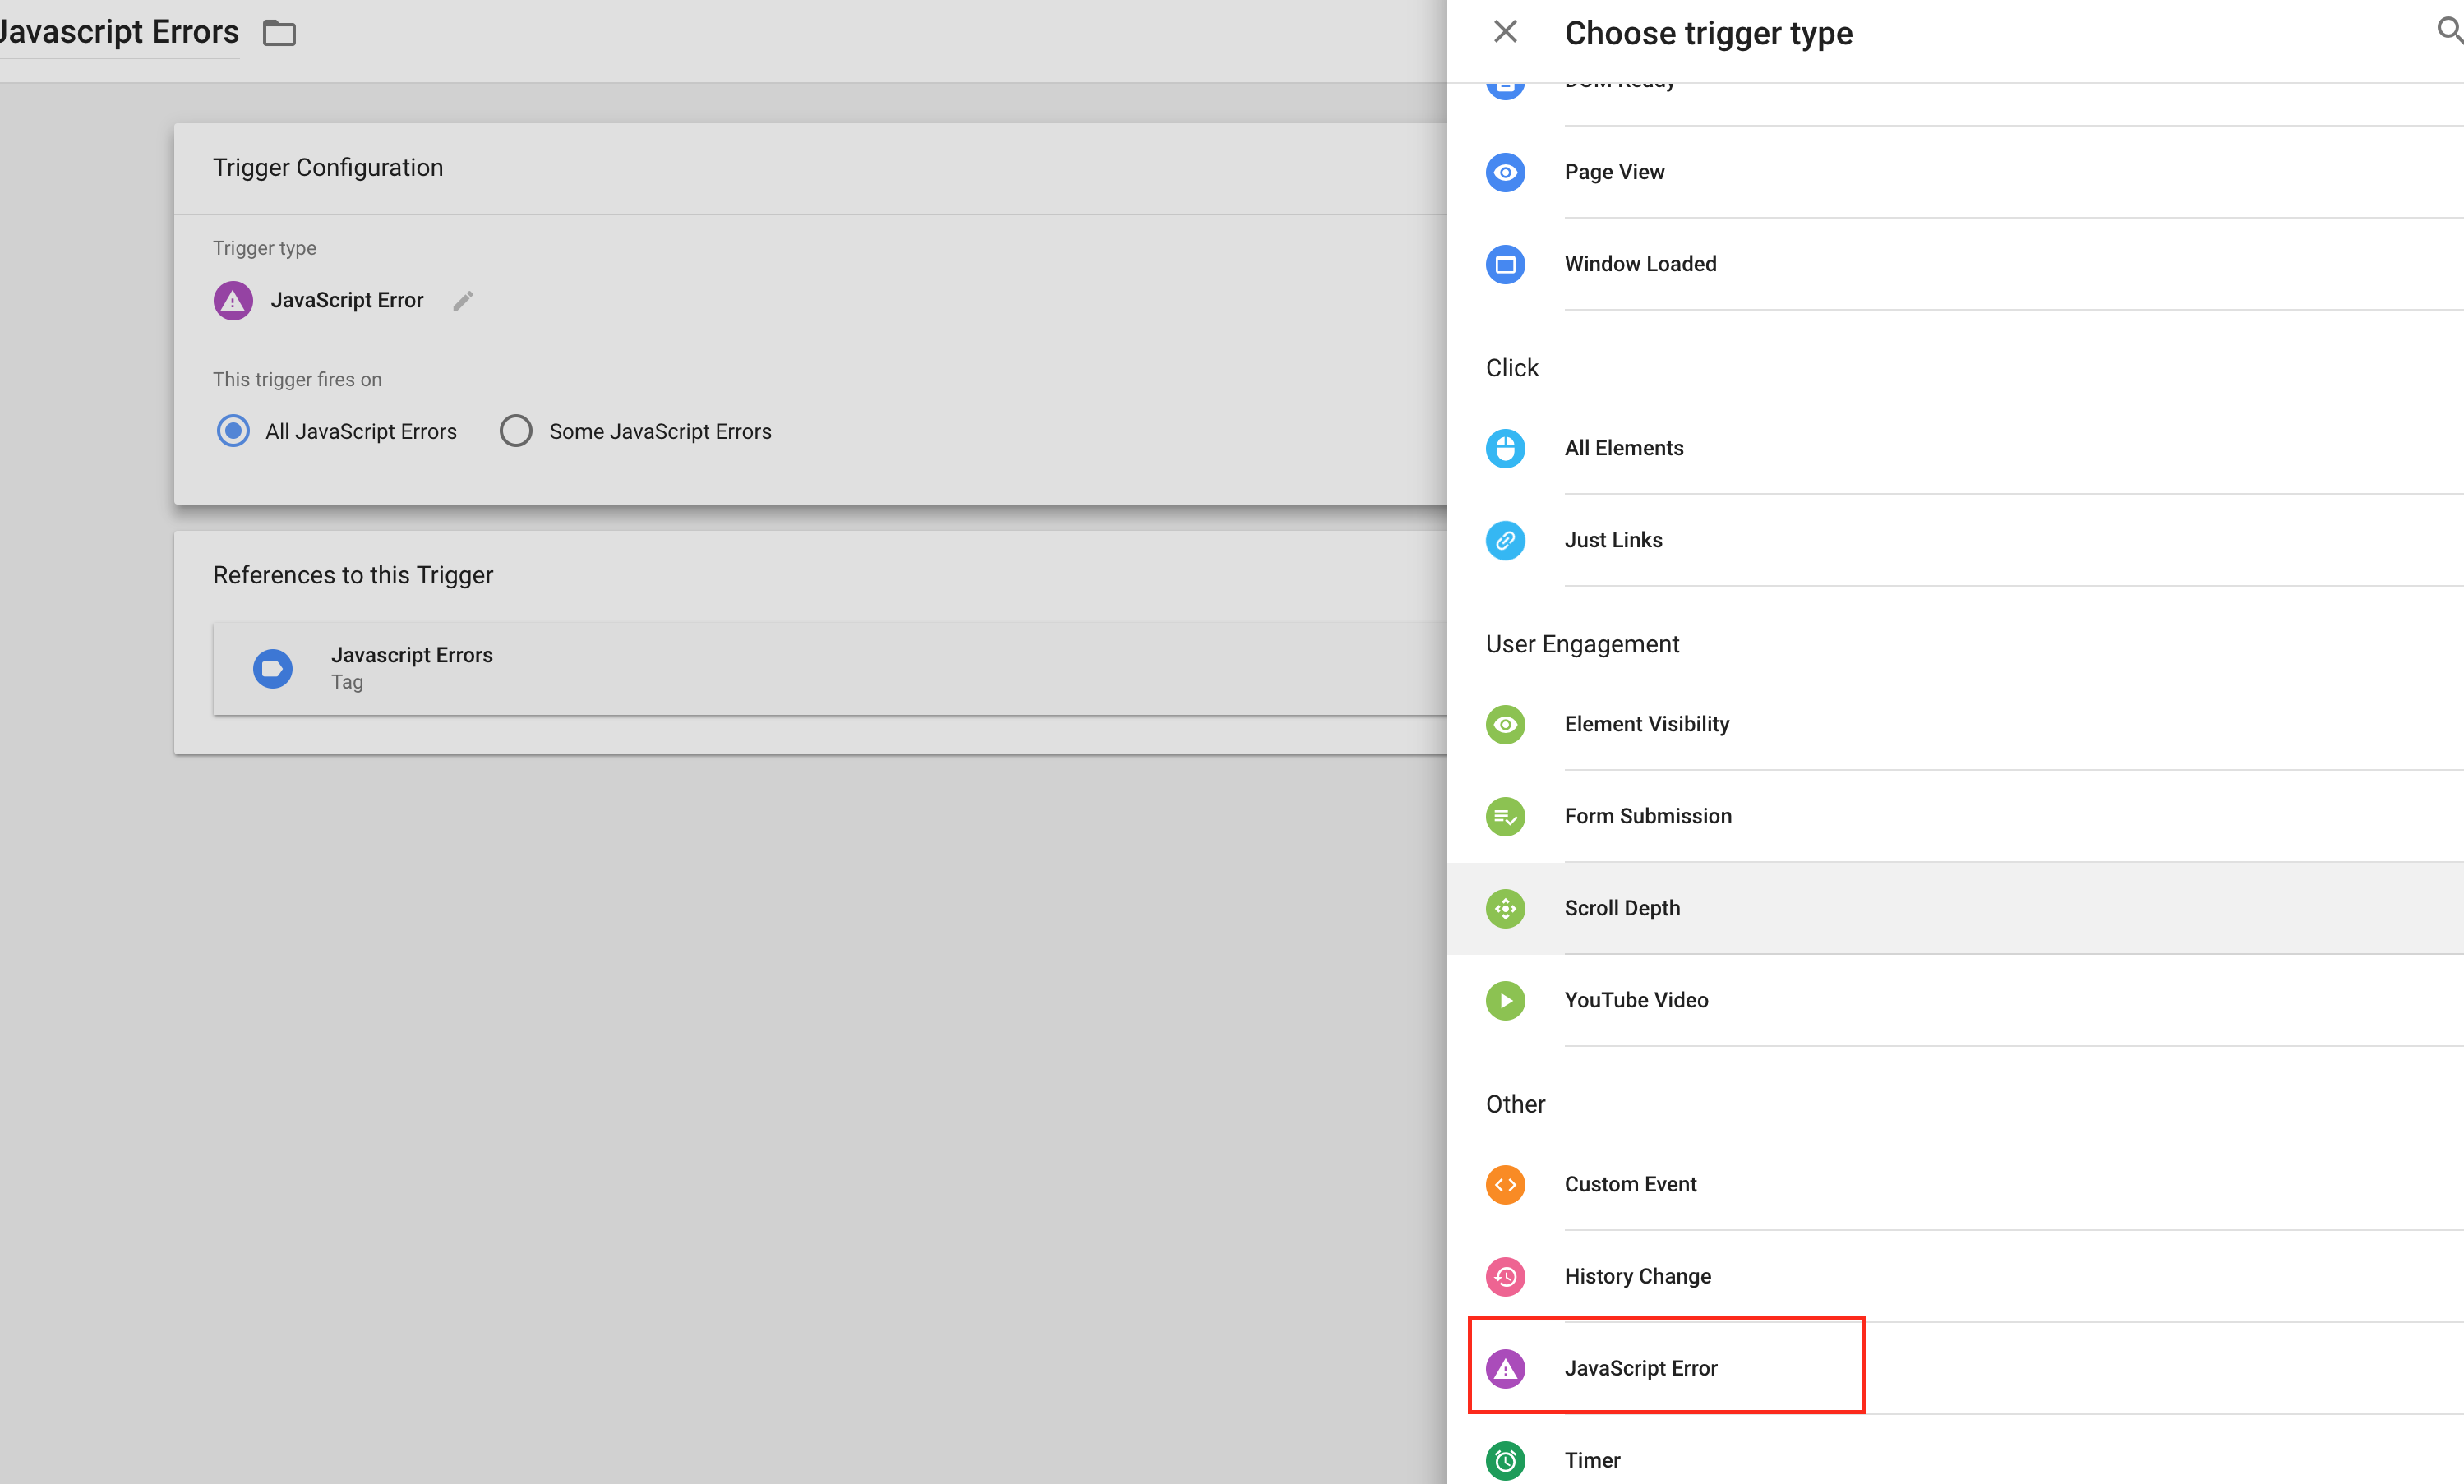
Step 2: Create Built-In Javascript Trigger
GTM > Workspace > Triggers > New Trigger:
Step 3: Create Universal Analytics Event Tag
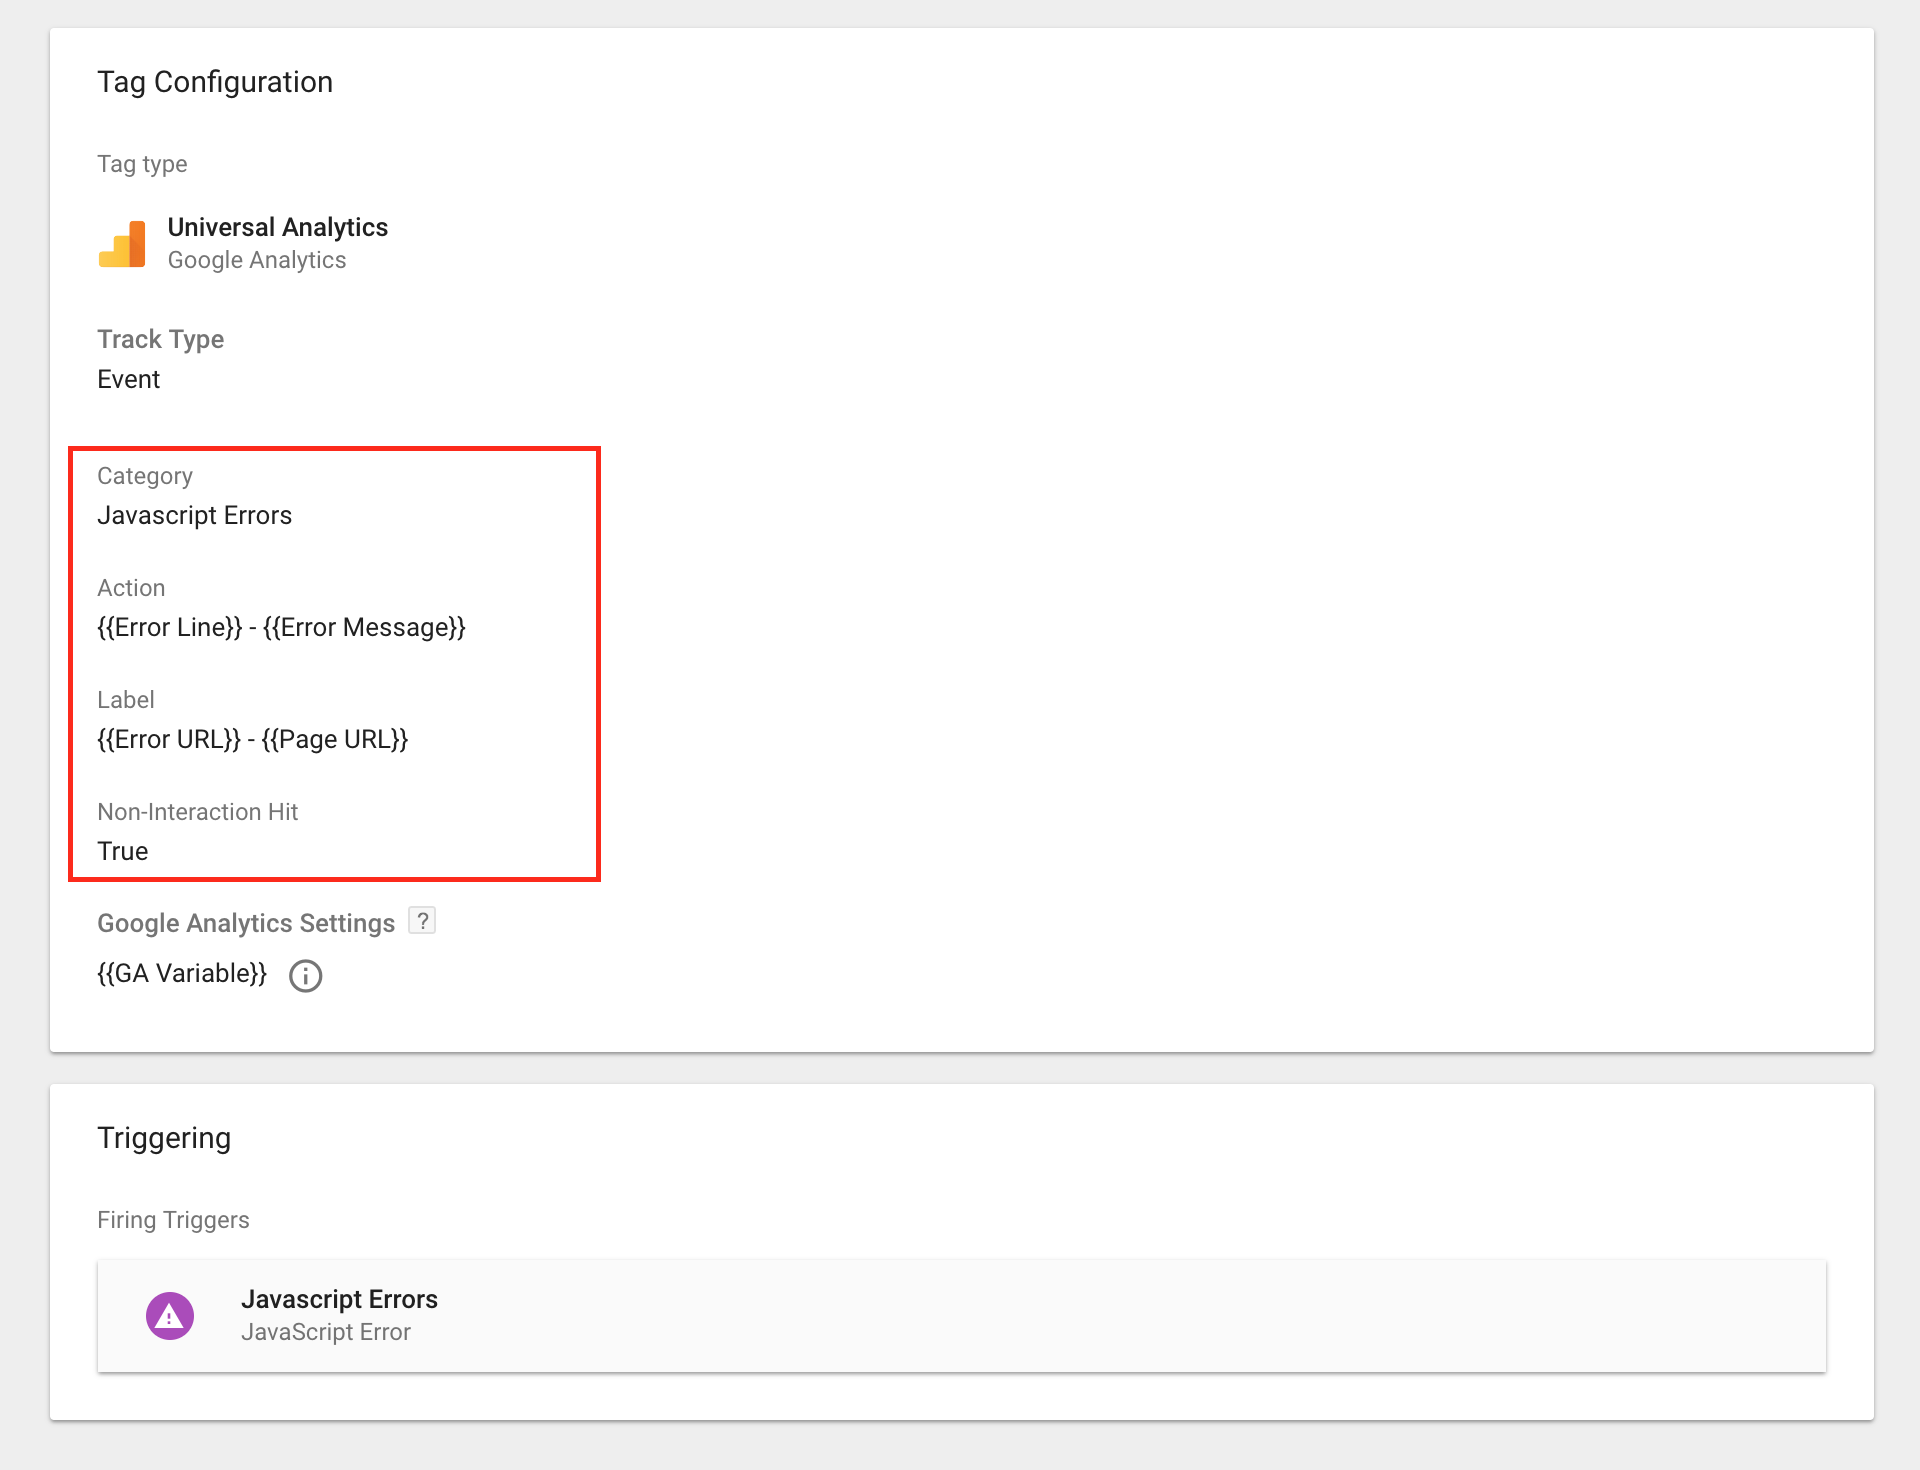
GTM > Workspace > Tags > New Tag > Tag Type: Universal Analytics > Track Type: Event
In this tag setup, I’m showing:
- Event Category: Javascript Errors
- Action: {{Error Line}} – {{Error Message}} (these are the error variables setup in step 1 which provides context on the error that was triggered)
- Label: {{Error URL}} – {{Page URL}} (the error URL displays the Javascript file URL where the error originates from where the Page URL is the page on your website where the error is seen)
- Non-Interaction Hit: True (this ensures the event is fired without affecting bounce rate, etc…basically it’s a silent event not triggered by user interaction)
Step 4: Test, Deploy, and Monitor
Once you have this setup and published in your production container then you can view your Behavior Event data in Google Analytics to begin monitoring.
Go to Google Analytics > Behavior > Events > Top Events > Category: Javascript Errors
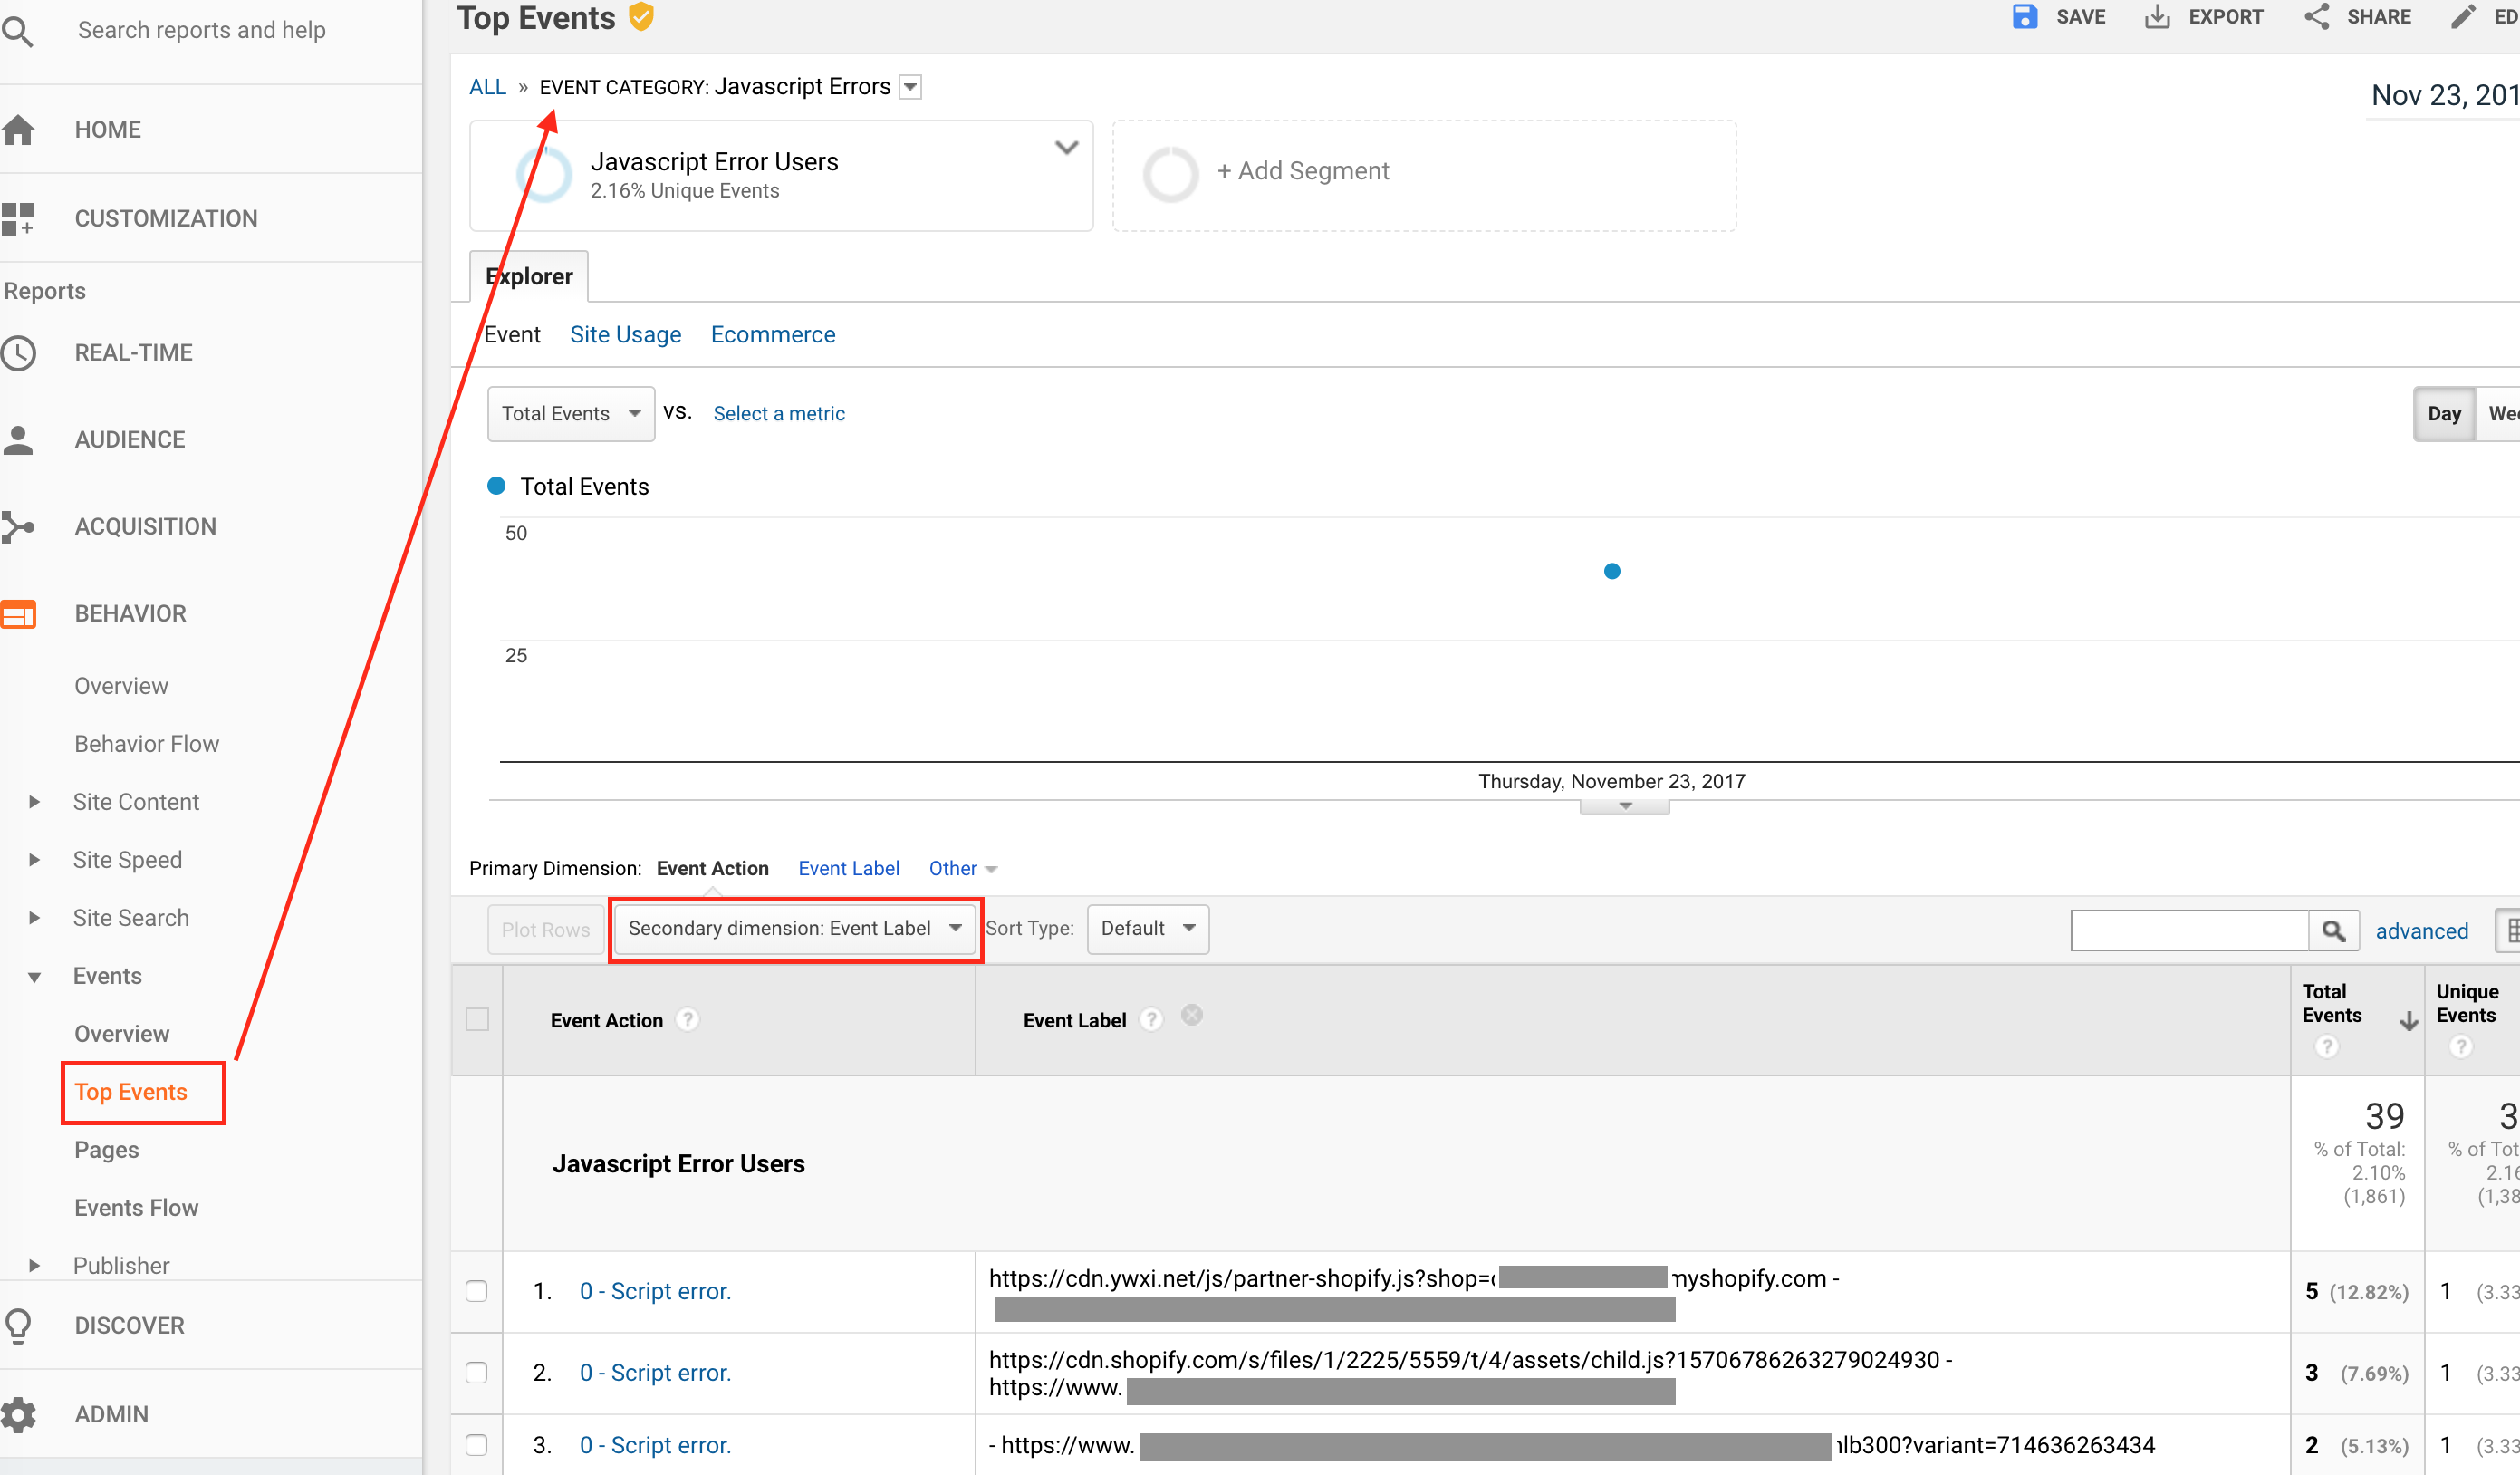
If this is empty then you may need to wait a few days for errors to occur.
Step 5: Triage Errors
In the example shown above for a client site I was seeing the cdn.ywxl.net URL show up more and more fairly consistently but had no clue where this was coming from. So I simply Google searched the URL and discovered this was coming from McAfee Site Secure. Problem not quite solved yet though…
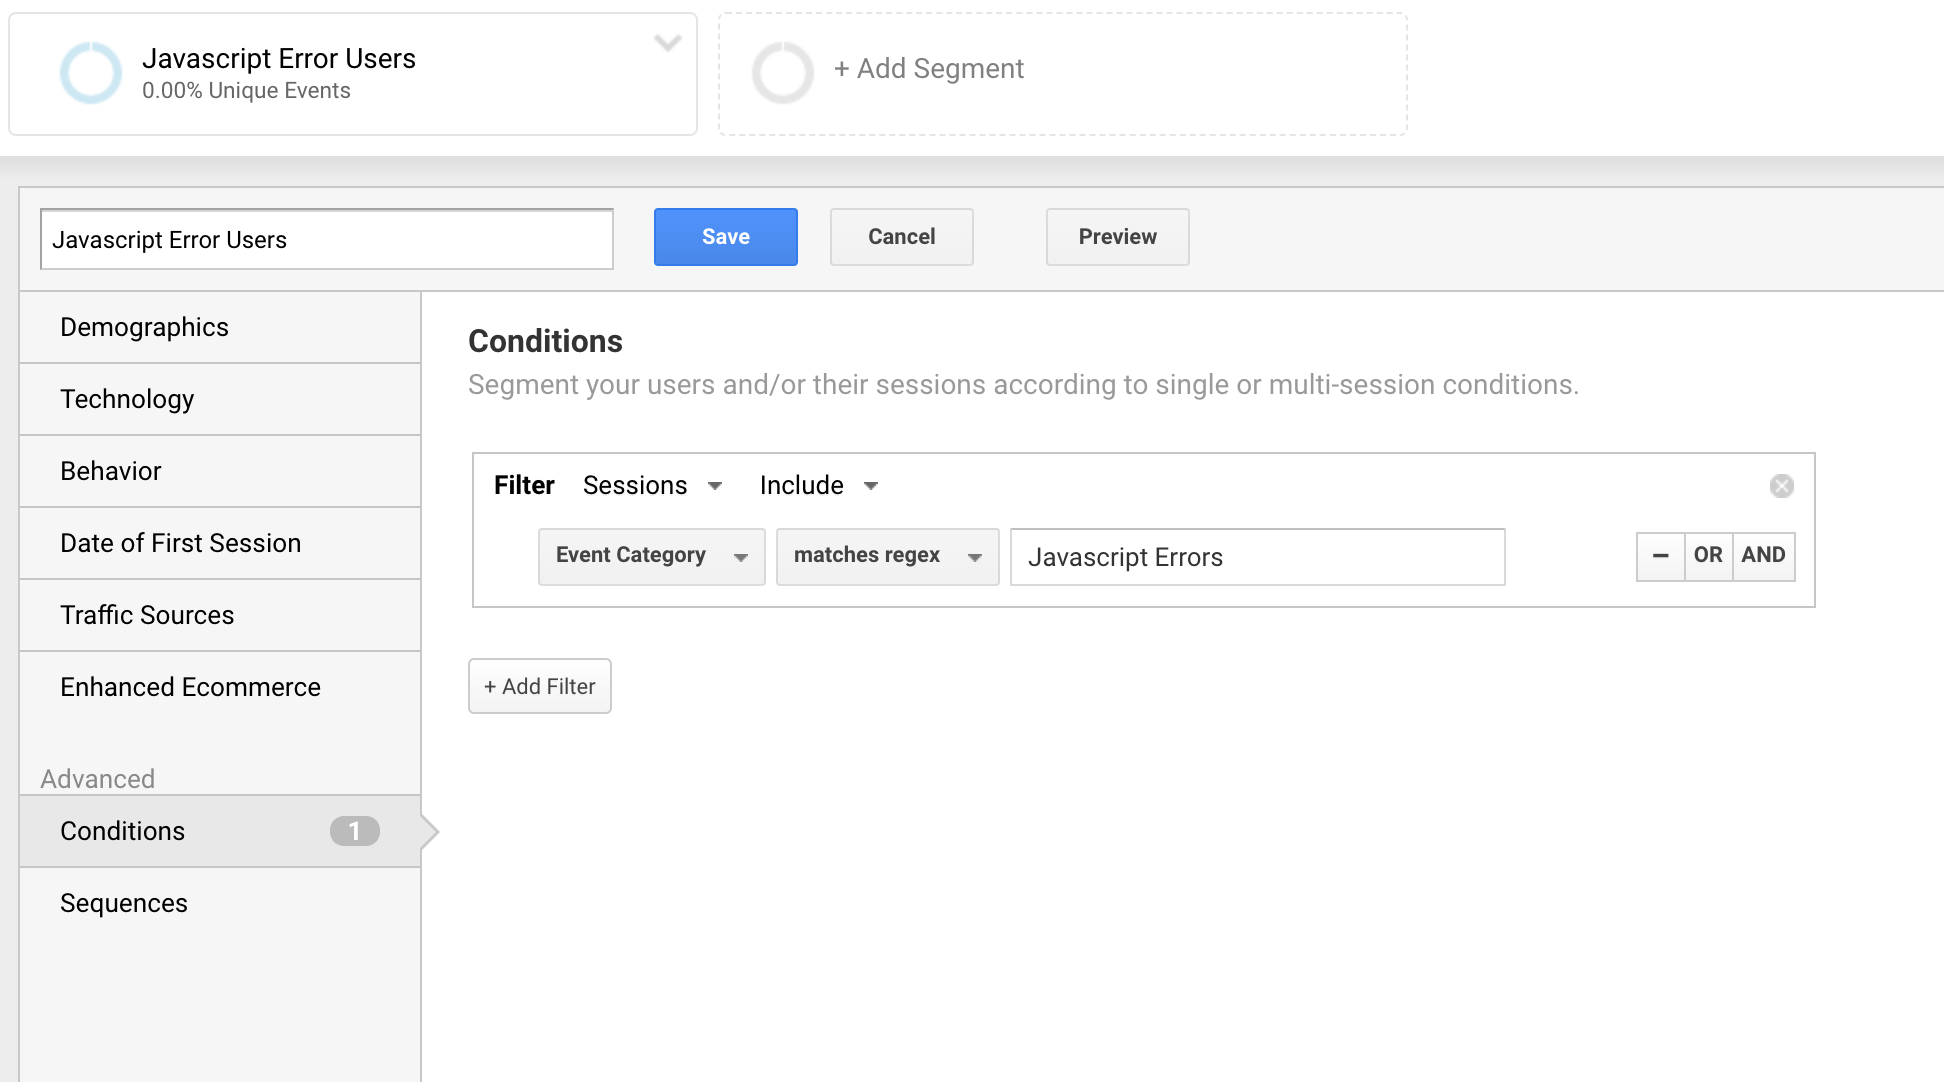
I assumed this might be specific to certain browsers, so I created a new custom segment (shown below):
And then navigated in Google Analytics to Audience > Technology > Browser & OS:
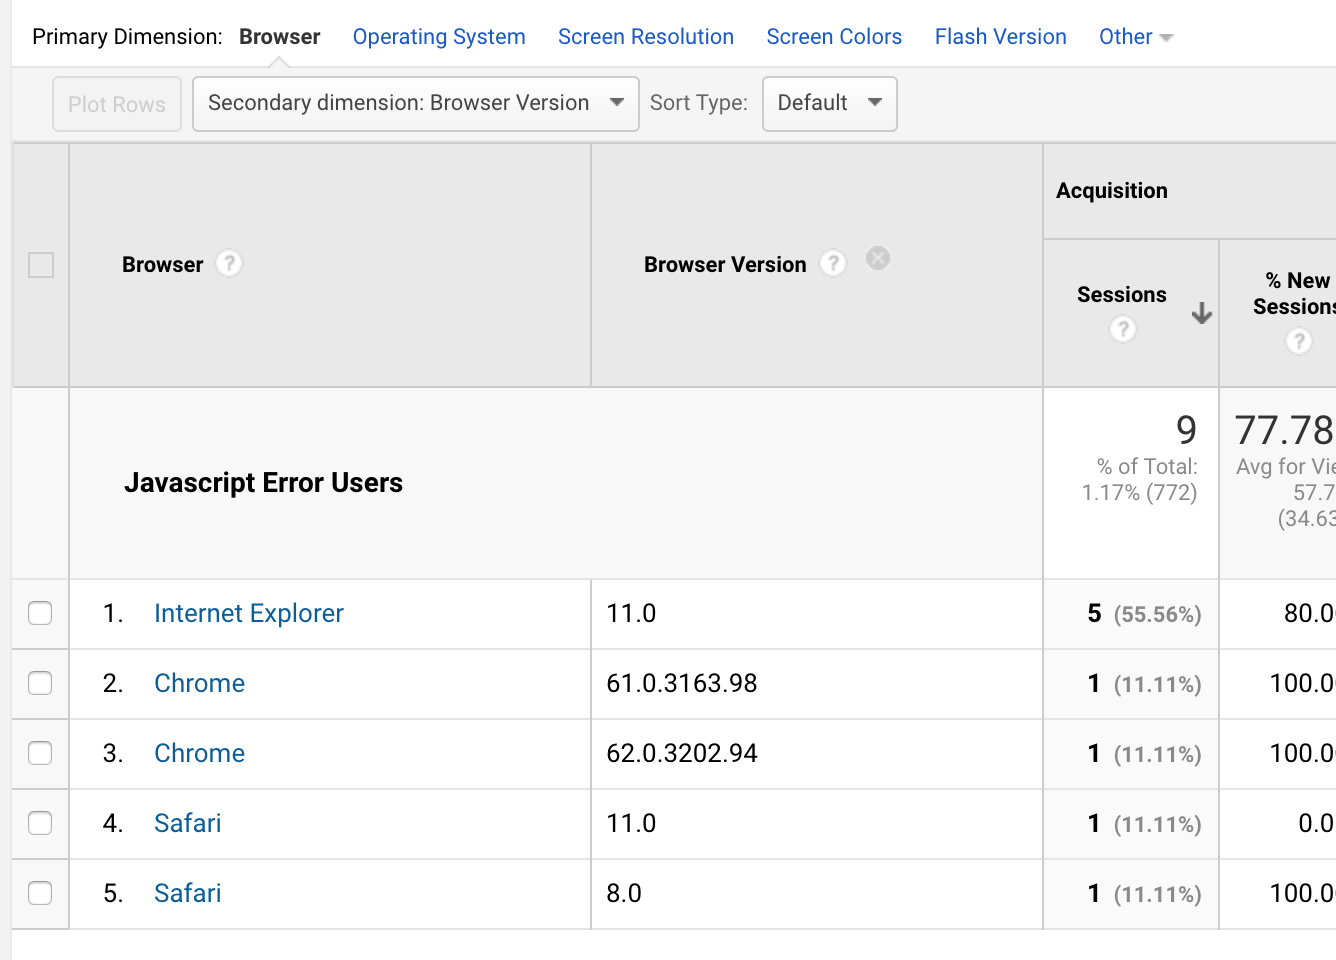
Since my segment was ONLY including users that contained Javascript Error events within their session, this browser version report showed me a ranking of browser versions triggering errors.
Obviously 5 sessions isn’t enough data to make a definitive decision on but if this continues to grow then we might look at ways to triage the IE11 issue or suppress the McAfee script completely from IE11.
What other use cases do you have for GTM’s native Javascript error tracking?


Leave a Reply