eCommerce Feature Analysis with Google Analytics
Implement a measurement strategy into new features that are expected to drive more revenue.

Brad Redding
Brad Redding is the Founder & CEO of Elevar. Specializing in analytics, tracking, GTM, and conversion optimization.
We’ve all been there: “This new feature for our website is a MUST HAVE. It must take priority and be developed and deployed, like, yesterday.”
Then, the response you get is:
“But, what about our roadmap that’s in progress or the bugs we need to resolve?”
You:
“I don’t care. This is THE feature that will double our revenue and blow up our account sign ups!”
Yep. I’ve been there … and still am many days (decision-making based in part on emotional gut feel).
“Gut feel” isn’t necessarily a bad thing. If we relied on data alone to drive 100% of our decisions, we’d cripple our innovative ideas where data doesn’t exist yet to prove our case.
That said, if you find yourself on the innovator side of these discussions and can’t (or don’t want to) A/B test your feature idea upfront, you’ll still need to do something to get your team’s buy-in. One proven way to do that is to agree to measure and report on your hypothesis (in this case, “doubling your revenue”) post-launch.
Fast forward. It’s nearing 30 days after launch, and you need to measure how your magical feature is performing. You can drum up a quick feature analysis report in Google Analytics if you take the necessary steps when deploying your new feature. I’m going to show you one example of how to do this.
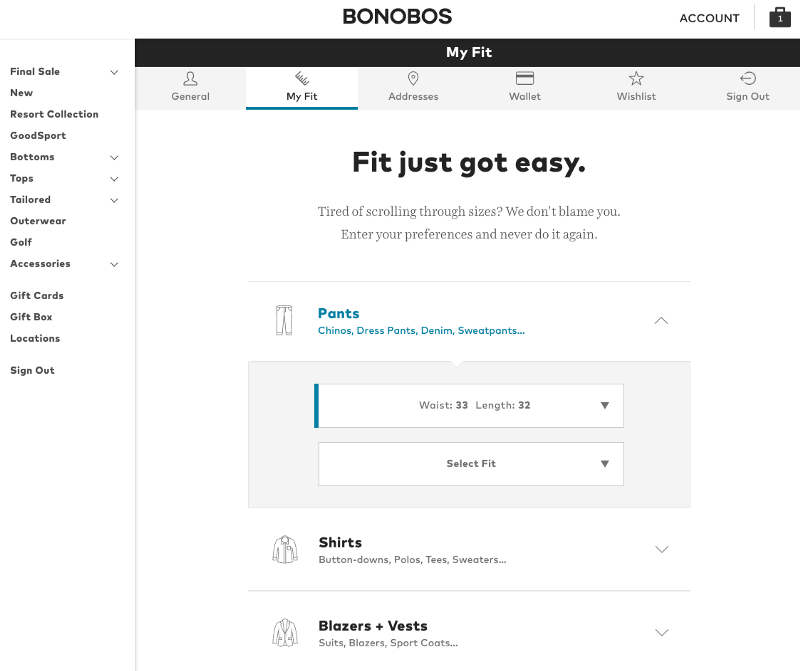
To demonstrate, I’m going to use the “My Fit” feature from Bonobos.com.
My Assumptions
Before blindly jumping into an analysis, you’ll want to take a minute to set your scenario. For example, does the utilization of this feature require any actions by users before you’re able to measure? In this case, yes it does!
Here are some other assumptions:
- This is a new feature that doesn’t exist at all on the site, so development is required.
- My analysis is looking at logged-in customers only — guests don’t apply here — for the first 30 days post-feature launch.
- I’m focusing my analysis for feature performance success on the utilization of any product type size selection (e.g., “Pants — waist 33, length 32, athletic fit).
- Revenue per visitor is going to be my primary KPI because I think this feature will drive a more personalized experience and enable users to get relevant (via size) products, faster.
- Customer lifetime value and time to purchase will be my secondary KPIs because I feel this feature will help enable better automated marketing initiatives — for example, enabling personalized emails with specific products in stock, displayed and linked to a user’s preferred size. One of our highest customer feedback topics is that items they see in an email blast are then not available in their specific sizes on the site. The goal would be to prevent the scenario: “Hey — shop this sale — oh wait, we don’t have your size.”
Note: I’m making all of this data up, by the way … I don’t work with or at @bonobos … just guessing here.
My Development Data Requirements
In order for me to have the data I need (to help me look smart!) and minimize KPI tunnel vision, I am going to implement the following Google Analytics custom events through Google Tag Manager (non-developers can learn how to here):
Event Category: Account — My Fit Preferences
Event Action: {category_type} — Size Preference Selection
Event Label: {selected_options}
So, an expected custom event triggered would be recorded in Google Analytics like this:
Event Category = Account — My Fit Preferences
Event Action = Pants — Size Preference Selection
Event Label = 33 32 Slim, Athletic
In the instance that you want to look back at a feature that doesn’t have custom events applied or you aren’t able to implement looking ahead, then a fallback would be to create a segment based on a user triggering a pageview on “www.bonobos.com/account/fit-preferences.”
We can make a reasonable assumption that a user might have used the feature if viewing it. Not ideal of course.
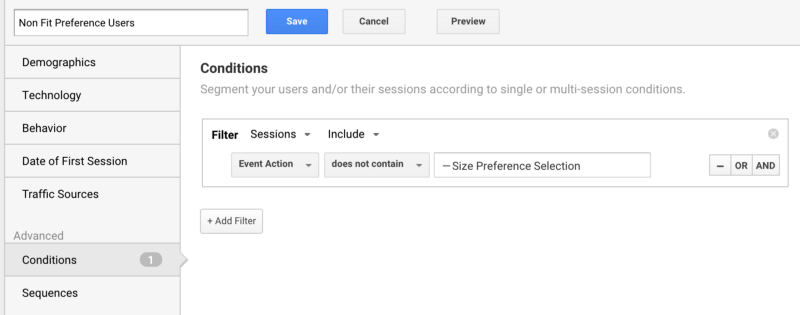
How to Create Custom Segments
My feature has been live for 30 days, and I’m ready for the litmus test. Here is how I’ll set up my segments for my feature analysis:
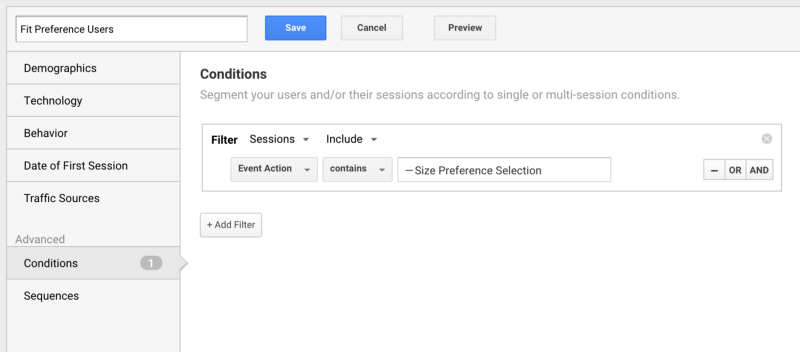
Segment # 1: Users who utilize the new Fit Preferences
This should be an easy segment to create with my fancy custom events already set up.
This segment allows me to view website and conversion data through the lens of only users who interacted with the Fit Preference feature.
Here’s how to do it:
Segment # 2: Users who do not utilize the new Fit Preferences
Just as easy, but the opposite of the segment above. This filters out data from any user who utilizes the My Fit Preference feature (i.e., these users never saved a preferred size for any product type).
Now I Analyze!
I have both segments created so now I’m ready and able to begin my analysis to see how this awesome new feature performs.
I’m using my primary KPI — revenue per visitor as my measurement stick. All I need to do is:
- Create a custom report (under “Customization” in Google Analytics) that has my dimension == medium so I can see how this performs across my different marketing channels.
- Add metrics of users, revenue per user (aka visitor), total revenue to give me my KPI data and a sense of total usage and revenue impact.
And voila — here’s my report that paints a pretty nice picture for me:
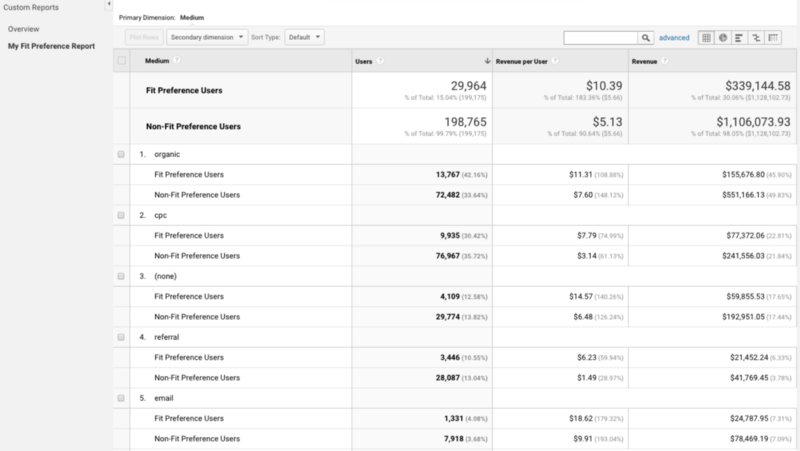
Revenue per user is more than double that for users utilizing the My Fit feature vs those who are not. WIN!
Well, not quite yet. What if this feature cost your team $100,000 to build?
Let’s do the math:
If this feature didn’t exist, then we can assume the 29,964 users that are in the “Fit Preference User” segment would revert back to the Non-Fit Preference User segment.
So, this means instead of this ~30K user segment producing ~$339,000 in revenue, they would only produce $153,715. Here’s how I calculated that:
29,964 users x $5.13 = $153,715
For our final back-of-the-napkin math:
- Total Revenue from Fit Preference Segment == ~$339,000
- Revenue for Segment if Fit Preference didn’t Exist == ~$153,000
- Difference == + $186,000
Now, to factor in the Cost of Goods Sold (at 40% margin) == $74,400 (calculated by $186,000 x 0.4)
- Net Profit == $74,400
- Less Cost to Build Feature == ($100,000)
Net +/- Difference == (-$25,600)
Data Conclusions
We can make the reasonable assumption that we will “break even” soon based on the successful first 30 days. And we’ll start realizing a net profit shortly thereafter IF the RPV conversion data remains roughly the same. So in conclusion, I would consider this feature on the fast track to a win without even going into our secondary KPIs of customer lifetime value and time to purchase.
While the initial double Revenue Per Visitor result ($10.39 vs $5.13) is exciting to see at first glance, it’s important to take other variables into consideration during your analysis, including:
- Cost of building the feature
- Cost of goods sold to establish a margin
- Data time frame. If this data was 12 months instead of 1 month, the conclusion would be very different. It would take > 1 year to break even on this feature.
Good luck with your measuring!