How to Build a GA4 Realtime Report (includes pictures.)
Step-by-step tutorial for building a GA4 realtime report (includes pictures.)

Kayle Larkin
Head of Marketing
Looking at GA4 reports to measure campaign performance in real time? Please read!
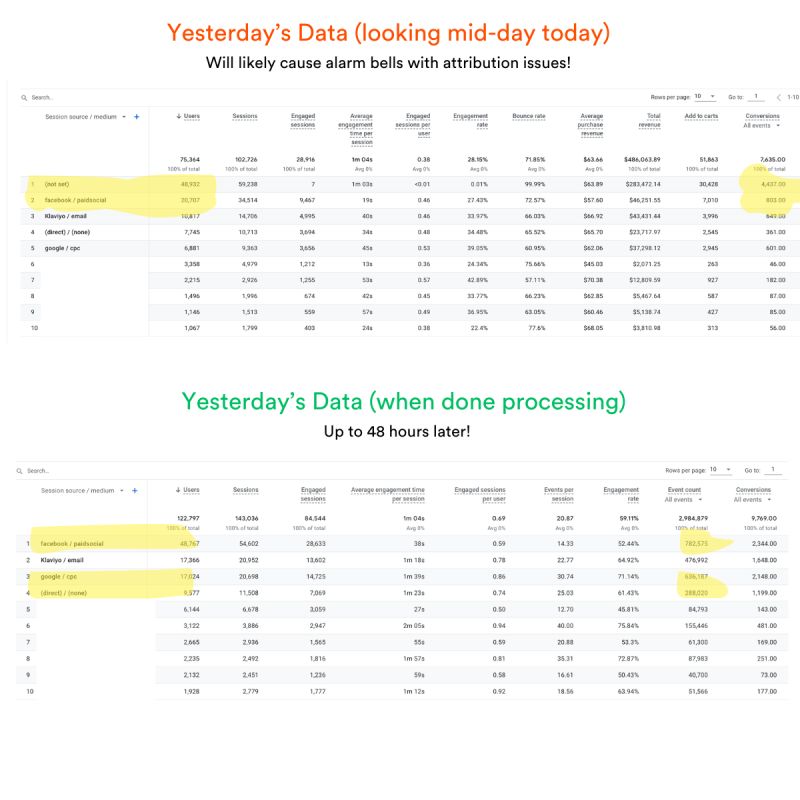
GA4 will be slower than UA was last year to provide same-day or even previous-day performance.
When analyzing within the GA4 user interface, know that yesterday’s report will look very different than it does when the data finishes processing (24 – 48 hours).
As data is processed, you will see (not set) or direct traffic decrease while paid channel attribution increases.
Keep reading because in this article, we share how to create a GA4 realtime report using Looker Studio and BigQuery:
- Link GA4 to BigQuery
- Add BigQuery data to Looker Studio
- Update Data Freshness
- Visualize GA4 Realtime Data
3 Steps to Building a GA4 Realtime Report
Before we start, know that Big Query data is not retroactive and takes some time to populate. So, if you have yet to link GA4 to Big Query, start there.
To create a realtime reporting dashboard in Looker Studio with GA4 data, follow these three steps:
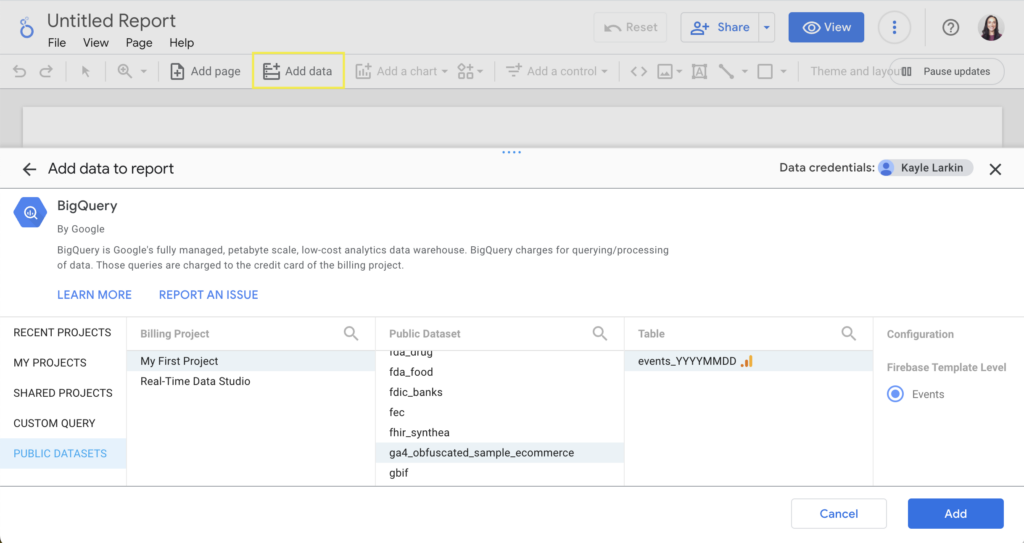
1. Add Big Query data to Looker Studio:
- Click “Add data.”
- Connect to data: “Big Query.”
- Choose your project.
- Choose the data set (property ID inside of GA4).
- Select “events_intraday table” (the one with streaming data).
- Choose events as a template.
- Click “Add.”
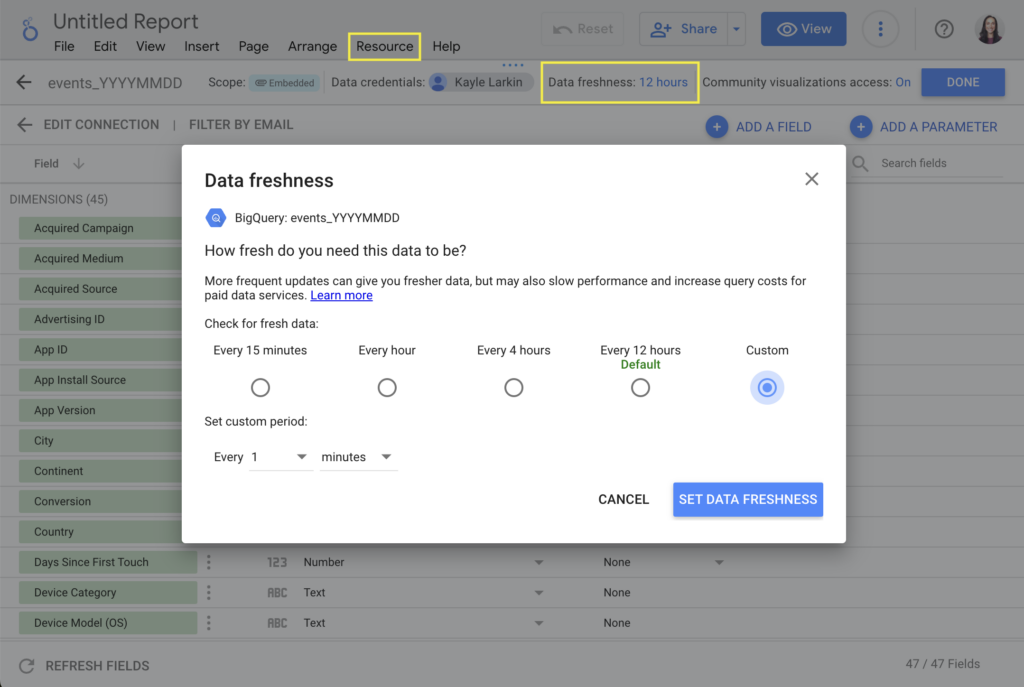
2. Update Data Freshness Setting:
To get the most up-to-date data available, update the data freshness setting within your data source.
- Click “Resource” in the top navigation.
- Select “Manage Added Data Sources.”
- Click to “Edit” the Big Query Data Source you just added.
- Click “Data freshness.”
- Adjust to Custom: Every 1 minute
- Set Data Freshness.
- Click Done.
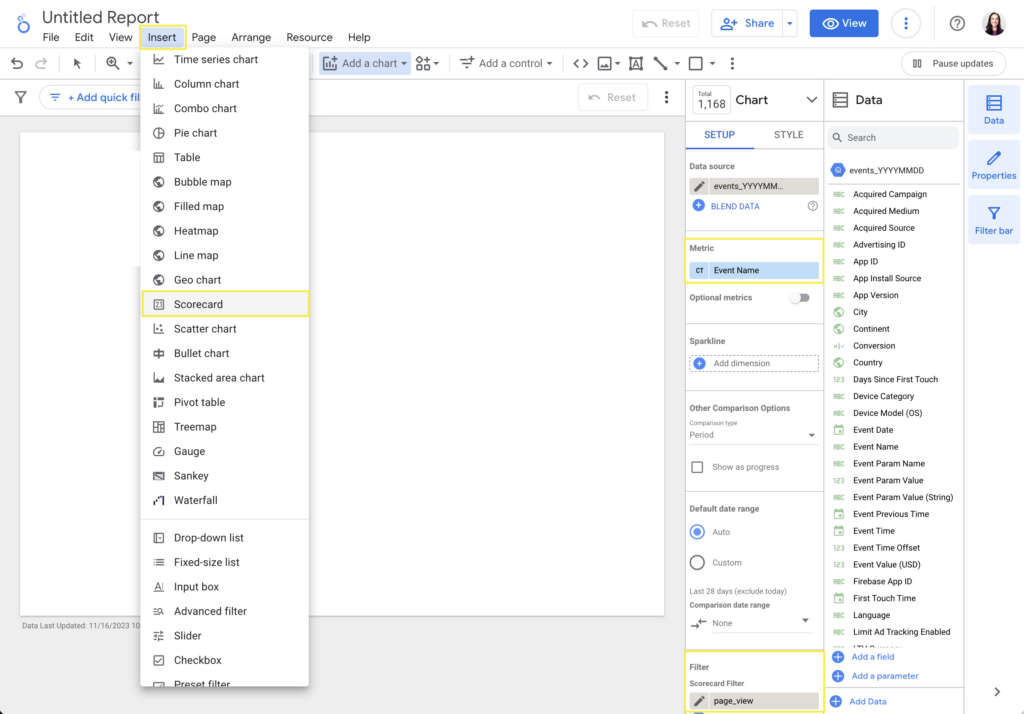
3. Visualize GA4 Realtime Data:
From here, it’s a matter of building a dashboard that answers your questions —combining scorecards, tables, or graphs and applying filters.
For example, let’s say we want an intraday count of page_views:
- Add a scorecard.
- Change metric to “event name.”
- Change the aggregation to “count.”
- Apply a filter: include > event name equal to “page_view.”
Editor Note:
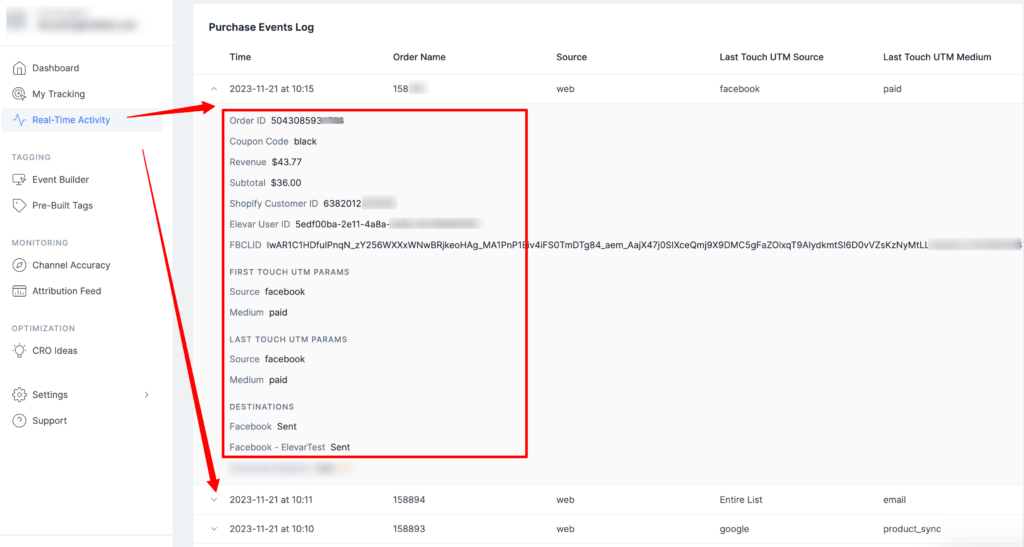
Elevar has a Realtime activity report that provides instant insights into what’s working right now – instead of what was working two days ago.
This is automatically available within the app dashboard.
Final Thoughts
Elevar’s Founder & CEO, Brad Redding, and Lead Solutions Engineer, Jon Cairo, shared insights from their talk with Johan van de Werken, a leading figure in Big Query and GA4.
They discussed comparing Big Query to Google Sheets, making realtime GA4 reports, and understanding ROI for Big Query investments [listen here].
If you prefer videos:
Watch Elevar’s YouTube tutorial with Stockton Fisher, or get a free GA4 dashboard by Vision Labs.
Staying up-to-date, testing, and adapting is crucial for brands in e-commerce.
Subscribe to The Conversion Tracking Playbook on Spotify or Apple for regular tracking, analytics, and conversion optimization episodes.
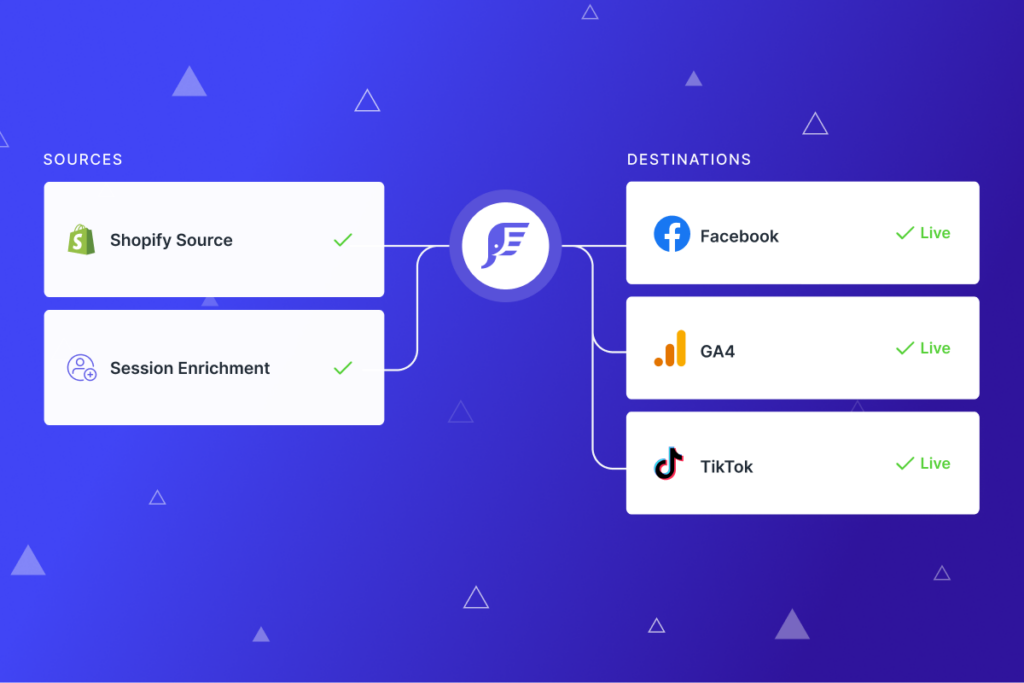
New to Elevar? We automate server-side conversion tracking for Shopify. Learn more about us!

Leave a Reply